Filters: Tags: Itawamba County (X)
48 results (68ms)|
Filters
Date Range
Contacts (Less)
Tag Types Tag Schemes
|
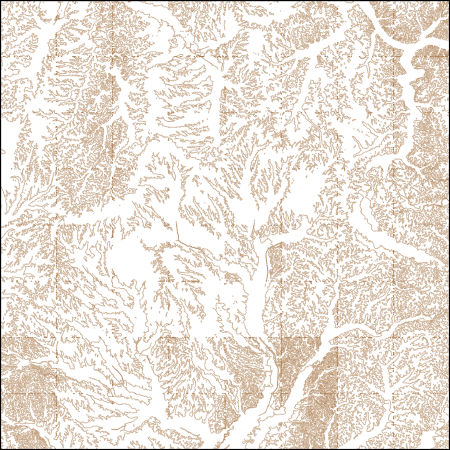
These vector contour lines are derived from the 3D Elevation Program using automated and semi-automated processes. They were created to support 1:24,000-scale CONUS and Hawaii, 1:25,000-scale Alaska, and 1:20,000-scale Puerto Rico / US Virgin Island topographic map products, but are also published in this GIS vector format. Contour intervals are assigned by 7.5-minute quadrangle, so this vector dataset is not visually seamless across quadrangle boundaries. The vector lines have elevation attributes (in feet above mean sea level on NAVD88), but this dataset does not carry line symbols or annotation.
This dataset represents aerial photography of the Natchez Trace Parkway that was taken in late September and early October of 2004. Images were acquired during leaf-on conditions as required by the National Park Service (NPS) to accomplish their ground-based vegetation classification. Nearly 400 aerial photography frames were scanned and orthorectified to generate digital orthophoto quarter quads (DOQQs). These were cut to match existing DOQQs creating a total of 235 DOQQs for the entire 715 km long Parkway. For ease of use, the DOQQs were grouped into 11 mosaics, each covering a section of the Parkway. At the request of the NPS, each mosaic was divided into ten tiles to allow for efficient loading on less robust...
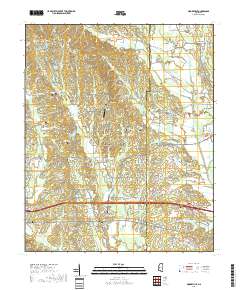
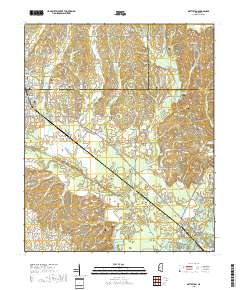
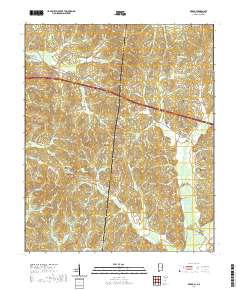
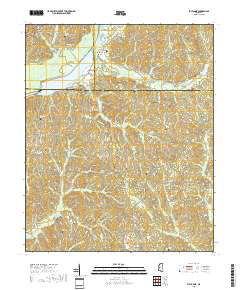
Layered geospatial PDF 7.5 Minute Quadrangle Map. Layers of geospatial data include orthoimagery, roads, grids, geographic names, elevation contours, hydrography, and other selected map features. This map is derived from GIS (geospatial information system) data. It represents a repackaging of GIS data in traditional map form, not creation of new information. The geospatial data in this map are from selected National Map data holdings and other government sources.
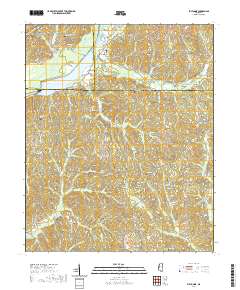
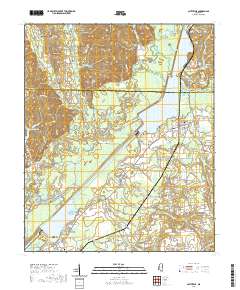
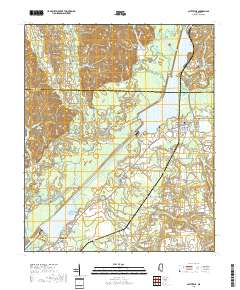
Layered geospatial PDF 7.5 Minute Quadrangle Map. Layers of geospatial data include orthoimagery, roads, grids, geographic names, elevation contours, hydrography, and other selected map features. This map is derived from GIS (geospatial information system) data. It represents a repackaging of GIS data in traditional map form, not creation of new information. The geospatial data in this map are from selected National Map data holdings and other government sources.
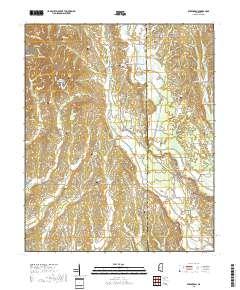
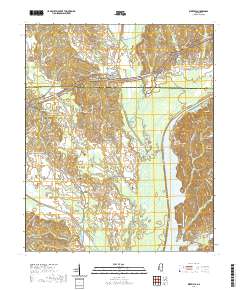
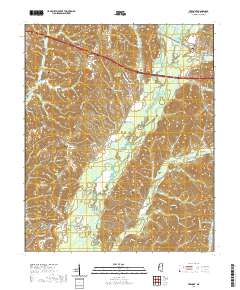
Layered geospatial PDF 7.5 Minute Quadrangle Map. Layers of geospatial data include orthoimagery, roads, grids, geographic names, elevation contours, hydrography, and other selected map features. This map is derived from GIS (geospatial information system) data. It represents a repackaging of GIS data in traditional map form, not creation of new information. The geospatial data in this map are from selected National Map data holdings and other government sources.
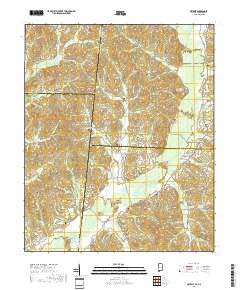
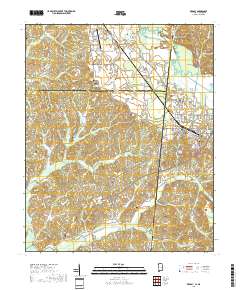
Layered geospatial PDF 7.5 Minute Quadrangle Map. Layers of geospatial data include orthoimagery, roads, grids, geographic names, elevation contours, hydrography, and other selected map features. This map is derived from GIS (geospatial information system) data. It represents a repackaging of GIS data in traditional map form, not creation of new information. The geospatial data in this map are from selected National Map data holdings and other government sources.
Layered geospatial PDF 7.5 Minute Quadrangle Map. Layers of geospatial data include orthoimagery, roads, grids, geographic names, elevation contours, hydrography, and other selected map features. This map is derived from GIS (geospatial information system) data. It represents a repackaging of GIS data in traditional map form, not creation of new information. The geospatial data in this map are from selected National Map data holdings and other government sources.
Layered geospatial PDF 7.5 Minute Quadrangle Map. Layers of geospatial data include orthoimagery, roads, grids, geographic names, elevation contours, hydrography, and other selected map features. This map is derived from GIS (geospatial information system) data. It represents a repackaging of GIS data in traditional map form, not creation of new information. The geospatial data in this map are from selected National Map data holdings and other government sources.
Layered geospatial PDF 7.5 Minute Quadrangle Map. Layers of geospatial data include orthoimagery, roads, grids, geographic names, elevation contours, hydrography, and other selected map features. This map is derived from GIS (geospatial information system) data. It represents a repackaging of GIS data in traditional map form, not creation of new information. The geospatial data in this map are from selected National Map data holdings and other government sources.
This dataset consists of linear features depicting the main road running through the Natchez Trace Parkway and other roads visible on the color infrared photography. The Parkway is a 715-km roadway that historically connected the southern portions of the Mississippi River to the salt licks in central Tennessee. The vector data represent the roadway of the Parkway at an approximate along-track (parallel and perpendicular to the road) with a spatial accuracy of about 3 meters or less.
This dataset consists of a map depicting the distribution of sweetgum-oak mixed forests along the Natchez Trace Parkway. Ground-based vegetation classification was provided by the National Park Service and mapped by the U.S. Geological Survey, National Wetlands Research Center. In the final version of "Mapping the Natchez Trace Parkway," the Sweetgum-Oak class was merged with the Sweetgum class because most of the time it co-occurred with the Sweetgum field sites.
This dataset defines the symbology for the landcover map of the Natchez Trace Parkway. The map shows the distribution of 18 landcover classes based on the National Vegetation Classification Standard. Ground-based vegetation classification was provided by National Park Service (NPS). The mapping output and layer delineate grasses, road-developed areas, scrub-shrub, shrubland, plantation, water bodies, areas of white oak, oak, pine-oak, pine-cedar, pine-sweetgum, sweetgum (including sweetgum-oak), scattered trees, swamp forest, irregular classes, aquatic vegetation, invasive species, canopy gaps, and clouds. Mapped classes that have been digitized are noted with an asterisk (*) in the legend.
Layered geospatial PDF 7.5 Minute Quadrangle Map. Layers of geospatial data include orthoimagery, roads, grids, geographic names, elevation contours, hydrography, and other selected map features. This map is derived from GIS (geospatial information system) data. It represents a repackaging of GIS data in traditional map form, not creation of new information. The geospatial data in this map are from selected National Map data holdings and other government sources.
This dataset consists of a map depicting suspected sites of invasive species along the Natchez Trace Parkway. Four invasive species were manually mapped and aggregated as an invasive species class. Ground-based vegetation classification was provided by the National Park Service and mapped by the U.S. Geological Survey, National Wetlands Research Center.
This dataset consists of a map depicting the distribution of irregular classes along the Natchez Trace Parkway. Irregular classes are those forest alliances that were usually represented by one or two field sites. In addition, these alliances did not align with any of the major forest classes and for the most part did not contain species that were common to other alliances. Ground-based vegetation classification was provided by the National Park Service and mapped by the U.S. Geological Survey, National Wetlands Research Center.
Layered geospatial PDF 7.5 Minute Quadrangle Map. Layers of geospatial data include orthoimagery, roads, grids, geographic names, elevation contours, hydrography, and other selected map features. This map is derived from GIS (geospatial information system) data. It represents a repackaging of GIS data in traditional map form, not creation of new information. The geospatial data in this map are from selected National Map data holdings and other government sources.
Layered geospatial PDF 7.5 Minute Quadrangle Map. Layers of geospatial data include orthoimagery, roads, grids, geographic names, elevation contours, hydrography, and other selected map features. This map is derived from GIS (geospatial information system) data. It represents a repackaging of GIS data in traditional map form, not creation of new information. The geospatial data in this map are from selected National Map data holdings and other government sources.
Layered geospatial PDF 7.5 Minute Quadrangle Map. Layers of geospatial data include orthoimagery, roads, grids, geographic names, elevation contours, hydrography, and other selected map features. This map is derived from GIS (geospatial information system) data. It represents a repackaging of GIS data in traditional map form, not creation of new information. The geospatial data in this map are from selected National Map data holdings and other government sources.
This dataset consists of a map depicting the landcover of the Natchez Trace Parkway. The mapping output was created using mosaiced color infrared aerial photography of the Parkway. The map shows the distribution of 18 landcover classes based on the National Vegetation Classification Standard. Ground-based vegetation classification was provided by the National Park Service (NPS). The mapping output delineates grasses, road-developed areas, scrub-shrub, shrubland, plantation, water bodies, areas of white oak, oak, pine-oak, pine-cedar, pine-sweetgum, sweetgum (including sweetgum-oak), scattered trees, swamp forest, irregular classes, aquatic vegetation, invasive species, canopy gaps, and clouds.Total mapped area includes...
Layered geospatial PDF 7.5 Minute Quadrangle Map. Layers of geospatial data include orthoimagery, roads, grids, geographic names, elevation contours, hydrography, and other selected map features. This map is derived from GIS (geospatial information system) data. It represents a repackaging of GIS data in traditional map form, not creation of new information. The geospatial data in this map are from selected National Map data holdings and other government sources.
|

|
