Filters: Tags: Marin County (X)
137 results (78ms)|
Filters
Date Range
Extensions (Less) Types (Less)
Contacts (Less)
Categories (Less) Tag Types
|
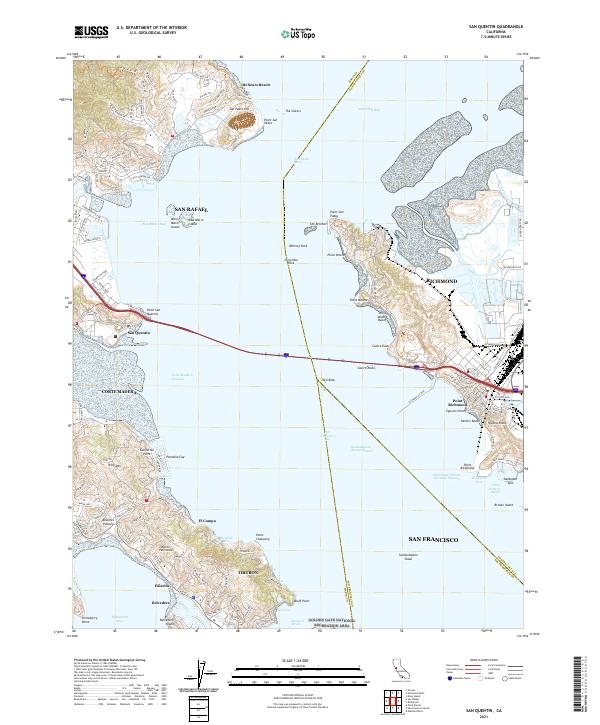
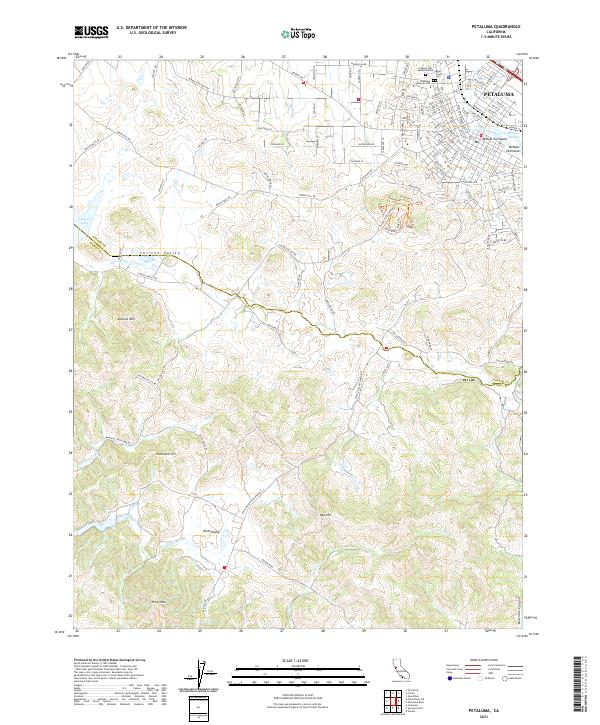
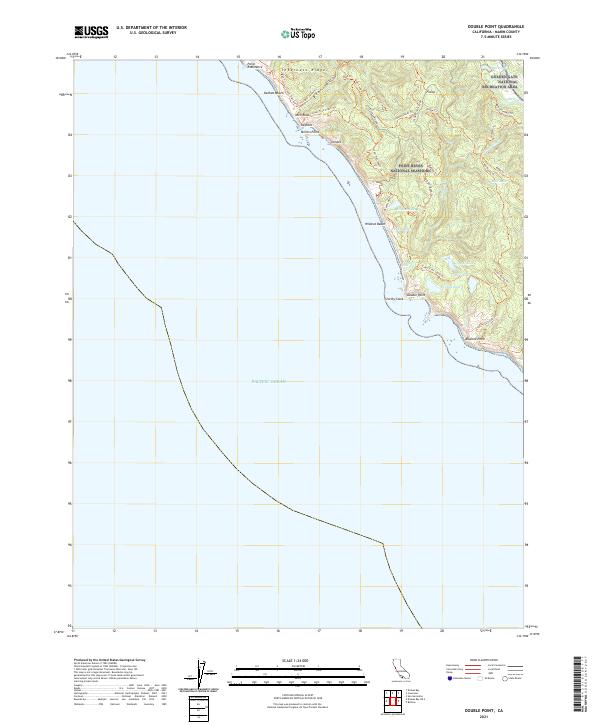
Layered geospatial PDF 7.5 Minute Quadrangle Map. Layers of geospatial data include orthoimagery, roads, grids, geographic names, elevation contours, hydrography, and other selected map features. This map is derived from GIS (geospatial information system) data. It represents a repackaging of GIS data in traditional map form, not creation of new information. The geospatial data in this map are from selected National Map data holdings and other government sources.
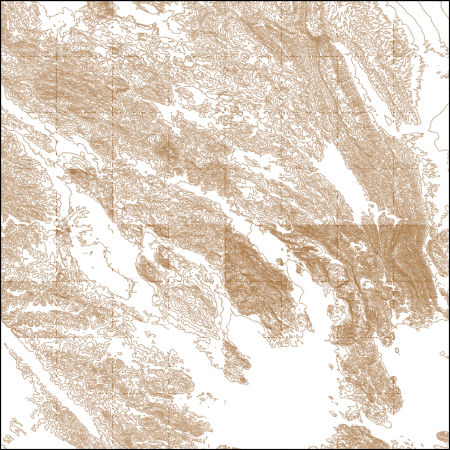
These vector contour lines are derived from the 3D Elevation Program using automated and semi-automated processes. They were created to support 1:24,000-scale CONUS and Hawaii, 1:25,000-scale Alaska, and 1:20,000-scale Puerto Rico / US Virgin Island topographic map products, but are also published in this GIS vector format. Contour intervals are assigned by 7.5-minute quadrangle, so this vector dataset is not visually seamless across quadrangle boundaries. The vector lines have elevation attributes (in feet above mean sea level on NAVD88), but this dataset does not carry line symbols or annotation.
California Red-legged Frogs (Rana draytonii) are typically regarded as inhabitants of permanent ponds, marshes, and slow-moving streams, but their ecology in other habitats, including coastal dunes, remains obscure. To avoid and minimize potential negative effects of dune restoration activities, we studied the spatial ecology, habitat selection, and survival of California Red-legged Frogs in coastal dune drainages at Point Reyes National Seashore, California. Frogs remained in their home drainages throughout the summer, and, with some notable exceptions, most remained close to water. Home ranges of California Red-legged Frogs in dunes were generally small, and they selected areas near water with logs that served...
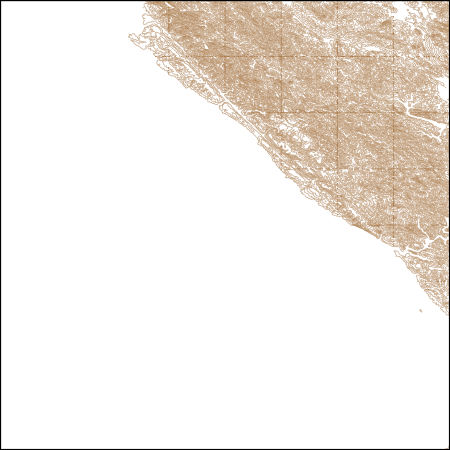
These vector contour lines are derived from the 3D Elevation Program using automated and semi-automated processes. They were created to support 1:24,000-scale CONUS and Hawaii, 1:25,000-scale Alaska, and 1:20,000-scale Puerto Rico / US Virgin Island topographic map products, but are also published in this GIS vector format. Contour intervals are assigned by 7.5-minute quadrangle, so this vector dataset is not visually seamless across quadrangle boundaries. The vector lines have elevation attributes (in feet above mean sea level on NAVD88), but this dataset does not carry line symbols or annotation.
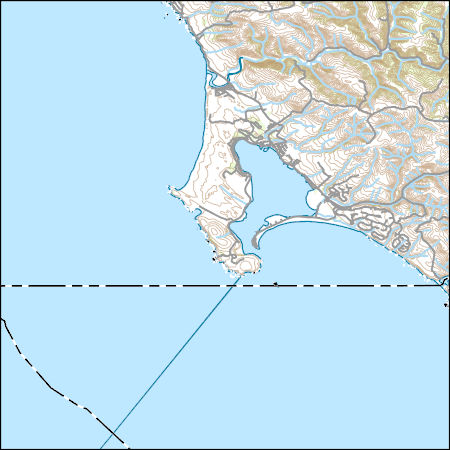
Layers of geospatial data include contours, boundaries, land cover, hydrography, roads, transportation, geographic names, structures, and other selected map features.
Layers of geospatial data include contours, boundaries, land cover, hydrography, roads, transportation, geographic names, structures, and other selected map features.
Files contain hydrodynamic and sediment transport data for the location and deployment indicated. Time-series data of water depth, velocity, turbidity, and temperature were collected in San Pablo Bay and China Camp Marsh as part of the San Francisco Bay Marsh Sediment Experiments. Several instruments were deployed in tidal creek, marsh, mudflat, and Bay locations, gathering data on water depth, velocity, salinity/temperature, and turbidity. Deployment data are grouped by region (Bay channel (main Bay), Bay shallows, tidal creek, or marsh/mudflat/upper tidal creek). Users are advised to check metadata and instrument information carefully for applicable time periods of specific data, as individual instrument deployment...
As part of the San Francisco Bay Marsh Sediment Experiments and hydrodynamic investigations in San Pablo Bay and China Camp Marsh, California, vegetation sampling measurements were taken over several periods at numerous locations. This portion of the data release presents physical characteristics and percent cover data from vegetation plots sampled in China Camp State Park salt marsh (northern San Francisco Bay) in 2015, 2016, and 2017. One-meter quadrats (1m x 1m) were analyzed for percent cover of each vegetation species present, average canopy height, and maximum canopy height. The percent cover was done by visual inspection. A quarter-meter quadrat (0.25m x 0.25m) was then used for stem count and stem diameter...
Files contain hydrodynamic and sediment transport data for the location and deployment indicated. Time-series data of water depth, velocity, turbidity, and temperature were collected in San Pablo Bay and China Camp Marsh as part of the San Francisco Bay Marsh Sediment Experiments. Several instruments were deployed in tidal creek, marsh, mudflat, and Bay locations, gathering data on water depth, velocity, salinity/temperature, and turbidity. Deployment data are grouped by region (Bay channel (main Bay), Bay shallows, tidal creek, or marsh/mudflat/upper tidal creek). Users are advised to check metadata and instrument information carefully for applicable time periods of specific data, as individual instrument deployment...
This data release has been deprecated. Please see new data release here: https://doi.org/10.5066/P9ETQ00R The U.S. Geological Survey Groundwater Ambient Monitoring and Assessment-Priority Basin Project (USGS GAMA-PBP) collected samples to be analyzed for per-and polyfluoroalkyl substances (PFAS) from domestic and public supply wells from May 2019 to June 2021. The datasets presented here include identification of the 28 PFAS constituents monitored by the project, Identification and brief characterization of the 395 GAMA-PBP wells for which samples were analyzed for PFAS during the study period, and analytical results for those groundwater samples, along with results for quality control samples.
On February 14, 2019, just before 2:56 am local time (Pacific Standard Time), a landslide initiated from the natural hillslopes above the City of Sausalito, California. The landslide, properly identified as a debris flow, overran a road (Sausalito Boulevard) located immediately below the landslide source area, and impacted and destroyed several residential structures. One person was located in one of the residences and survived the disaster after being transported in their home down the slope. The U.S. Geological Survey responded to this event within hours of the landslide and provided situational awareness of possible secondary landslide hazards associated with the event. The USGS also rapidly mobilized its topographic...
This data release includes chirp seismic-reflection data collected in 2014 aboard the USGS R/V Snavely in San Pablo Bay, part of northern San Francisco Bay. These data were acquired to image the shallow geologic structure, particularly that related to the Hayward and Rodgers Creek Faults. Approximately 200 km of marine seismic-reflection data were collected along primarily northeast and northwest-trending profiles spaced 1-km apart using an Edgetech 512 chirp sub-bottom profiler that was towed alongside the vessel on a sled at the sea surface. Data were acquired using a 2-12 kHz sweep with a 20 ms length fired 6 times per second. Initial processing included subsampling at twice the sample interval to make swell...
Categories: Data;
Types: Citation,
Downloadable,
Map Service,
OGC WFS Layer,
OGC WMS Layer,
Shapefile;
Tags: Bathymetry,
Continental Margins,
Contra Costa County,
Mare Island,
Marin County,
Layered geospatial PDF 7.5 Minute Quadrangle Map. Layers of geospatial data include orthoimagery, roads, grids, geographic names, elevation contours, hydrography, and other selected map features. This map is derived from GIS (geospatial information system) data. It represents a repackaging of GIS data in traditional map form, not creation of new information. The geospatial data in this map are from selected National Map data holdings and other government sources.
Layered geospatial PDF 7.5 Minute Quadrangle Map. Layers of geospatial data include orthoimagery, roads, grids, geographic names, elevation contours, hydrography, and other selected map features. This map is derived from GIS (geospatial information system) data. It represents a repackaging of GIS data in traditional map form, not creation of new information. The geospatial data in this map are from selected National Map data holdings and other government sources.
Layered geospatial PDF 7.5 Minute Quadrangle Map. Layers of geospatial data include orthoimagery, roads, grids, geographic names, elevation contours, hydrography, and other selected map features. This map is derived from GIS (geospatial information system) data. It represents a repackaging of GIS data in traditional map form, not creation of new information. The geospatial data in this map are from selected National Map data holdings and other government sources.
Layered geospatial PDF 7.5 Minute Quadrangle Map. Layers of geospatial data include orthoimagery, roads, grids, geographic names, elevation contours, hydrography, and other selected map features. This map is derived from GIS (geospatial information system) data. It represents a repackaging of GIS data in traditional map form, not creation of new information. The geospatial data in this map are from selected National Map data holdings and other government sources.
Layered geospatial PDF 7.5 Minute Quadrangle Map. Layers of geospatial data include orthoimagery, roads, grids, geographic names, elevation contours, hydrography, and other selected map features. This map is derived from GIS (geospatial information system) data. It represents a repackaging of GIS data in traditional map form, not creation of new information. The geospatial data in this map are from selected National Map data holdings and other government sources.
Layered geospatial PDF 7.5 Minute Quadrangle Map. Layers of geospatial data include orthoimagery, roads, grids, geographic names, elevation contours, hydrography, and other selected map features. This map is derived from GIS (geospatial information system) data. It represents a repackaging of GIS data in traditional map form, not creation of new information. The geospatial data in this map are from selected National Map data holdings and other government sources.
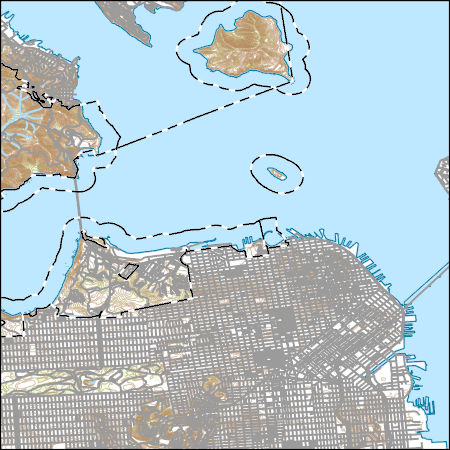
Layers of geospatial data include contours, boundaries, land cover, hydrography, roads, transportation, geographic names, structures, and other selected map features.
Layers of geospatial data include contours, boundaries, land cover, hydrography, roads, transportation, geographic names, structures, and other selected map features.
|

|
