Filters: Tags: UT (X)
11,721 results (16ms)|
Filters
|
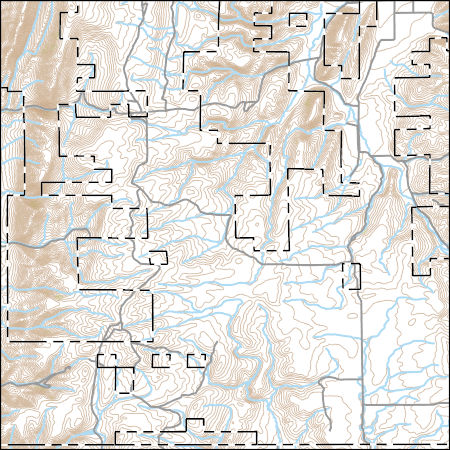
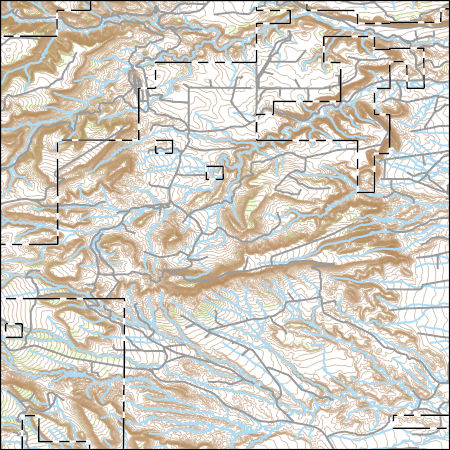
USGS Topo Map Vector Data (Vector) 34636 Pegram Creek, Idaho 20200715 for 7.5 x 7.5 minute Shapefile
Layers of geospatial data include contours, boundaries, land cover, hydrography, roads, transportation, geographic names, structures, and other selected map features.
Types: Citation;
Tags: 7.5 x 7.5 minute,
7.5 x 7.5 minute,
Bear Lake County,
Combined Vector,
Combined Vector,
Millcreek Canyon. Creek at the elbow
This dataset provides timeseries data on water quality and quantity, as collected or computed from outside sources. The format is many tables with one row per time series observation (1 tab-delimited file per site-variable combination, 1 zip file per site). This compilation of data is intended for use in estimating or interpreting metabolism. Sites were included if they met the initial criteria of having at least 100 dissolved oxygen observations and one of the accepted NWIS site types ('ST','ST-CA','ST-DCH','ST-TS', or 'SP'). This dataset is part of a larger data release of metabolism model inputs and outputs for 356 streams and rivers across the United States (https://doi.org/10.5066/F70864KX). The complete release...
Millcreek Canyon. Creek at the elbow
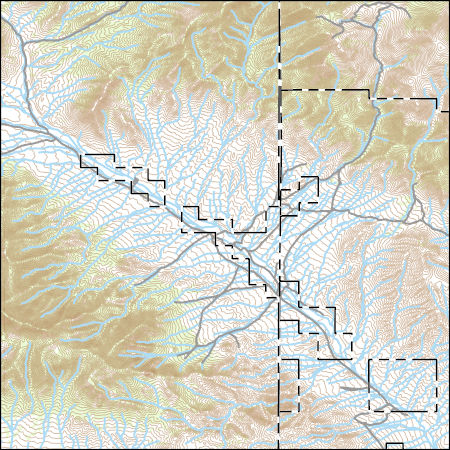
Layers of geospatial data include contours, boundaries, land cover, hydrography, roads, transportation, geographic names, structures, and other selected map features.
Types: Citation;
Tags: 7.5 x 7.5 minute,
7.5 x 7.5 minute,
Combined Vector,
Combined Vector,
Combined Vector,
The RCMAP (Rangeland Condition Monitoring Assessment and Projection) dataset quantifies the percent cover of rangeland components across the western U.S. using Landsat imagery from 1985-2021. The RCMAP product suite consists of nine fractional components: annual herbaceous, bare ground, herbaceous, litter, non-sagebrush shrub, perennial herbaceous, sagebrush, shrub, and tree, in addition to the temporal trends of each component. Several enhancements were made to the RCMAP process relative to prior generations. First, we have trained time-series predictions directly from 331 high-resolution sites collected from 2013-2018 from Assessment, Inventory, and Monitoring (AIM) instead of using the 2016 “base” map as an intermediary....
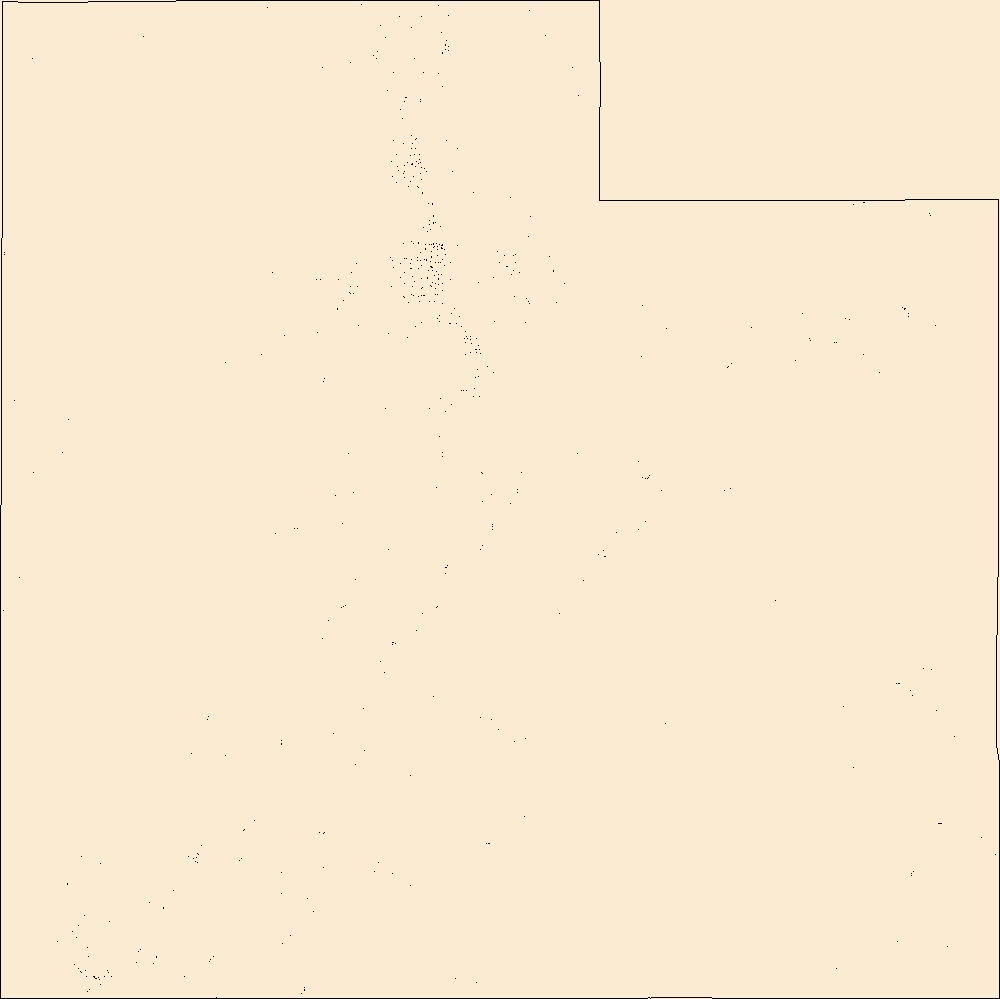
Geospatial data includes structures and other selected map features.
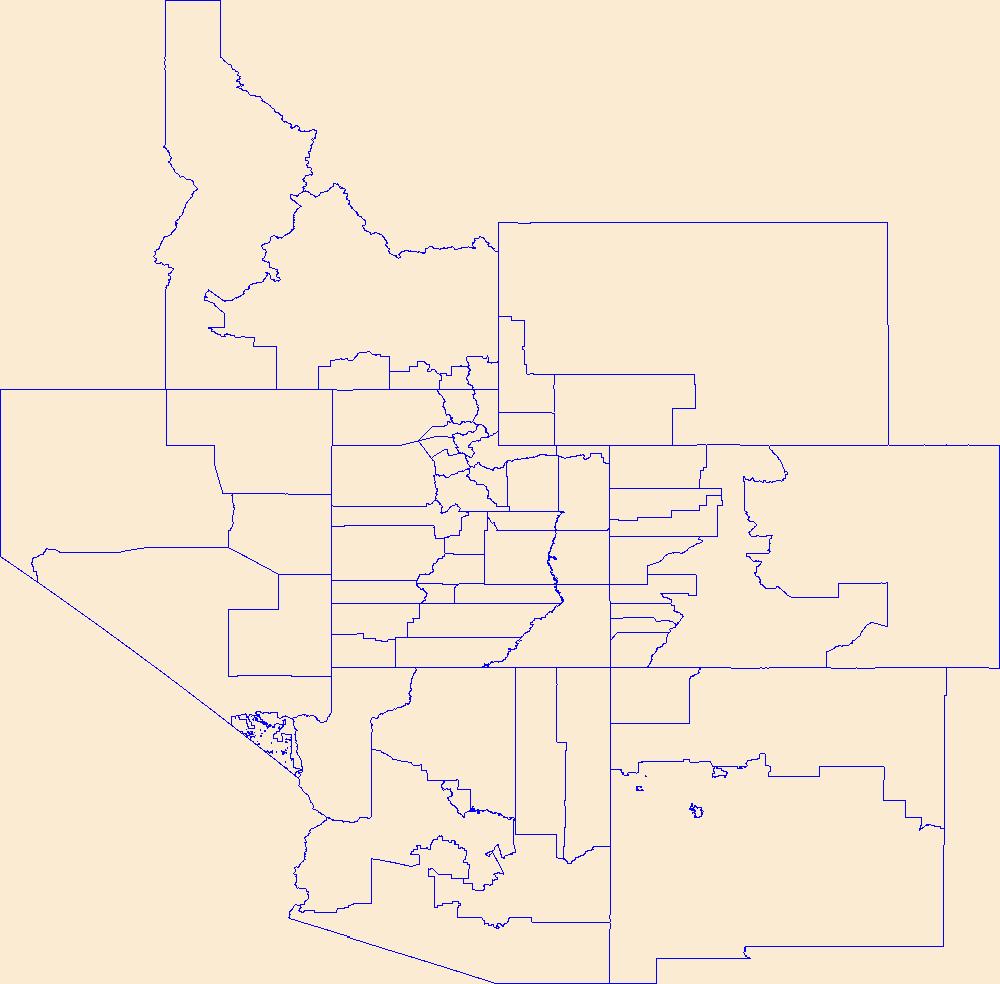
Geospatial data is comprised of government boundaries.
Accurate and consistent estimates of shrubland ecosystem components are crucial to a better understanding of ecosystems condition in arid and semiarid lands. We developed an innovative approach by integrating multiple information to quantify shrubland components as continuous field products within the National Land Cover Database (NLCD). The approach consists of five major parts: field sample collection, high-resolution mapping of shrubland components using WorldView-3 imagery and regression tree models, Landsat 8 radiometric balancing and phenological mosaicking, coarse resolution estimate of shrubland components across a large geographic extent using Landsat 8 phenological mosaics and regression tree models, and...
Accurate and consistent estimates of shrubland ecosystem components are crucial to a better understanding of ecosystems condition in arid and semiarid lands. We developed an innovative approach by integrating multiple information to quantify shrubland components as continuous field products within the National Land Cover Database (NLCD). The approach consists of five major parts: field sample collection, high-resolution mapping of shrubland components using WorldView-3 imagery and regression tree models, Landsat 8 radiometric balancing and phenological mosaicking, coarse resolution estimate of shrubland components across a large geographic extent using Landsat 8 phenological mosaics and regression tree models, and...
This polygon feature class represents vegetation communities mapped at Canyonlands National Park. The polygons were generated using guidelines set by the Standardized National Vegetation Classification System (October 1995). A combination of methods were used to map Canyonlands. The USGS used e-Cognition software to create segments. The segments created were then looked at and extensively edited by the vegetation mappers. Some mapping was done on screen, using the 2002 imagery. Hard copy 9X9 photography was used for photo interpretation. Traditional image interpretation cues were used to develop the polygons, such as shape, size, pattern, tone, texture, color, and shadow. Additional data layers were used in aiding...

The Geographic Names Information System (GNIS) is the Federal standard for geographic nomenclature. The U.S. Geological Survey developed the GNIS for the U.S. Board on Geographic Names, a Federal inter-agency body chartered by public law to maintain uniform feature name usage throughout the Government and to promulgate standard names to the public. The GNIS is the official repository of domestic geographic names data; the official vehicle for geographic names use by all departments of the Federal Government; and the source for applying geographic names to Federal electronic and printed products of all types.
Layers of geospatial data include contours, boundaries, land cover, hydrography, roads, transportation, geographic names, structures, and other selected map features.
Types: Citation;
Tags: 7.5 x 7.5 minute,
7_5_Min,
Combined Vector,
Combined Vector,
Combined Vector,
Layers of geospatial data include contours, boundaries, land cover, hydrography, roads, transportation, geographic names, structures, and other selected map features.
Types: Citation;
Tags: 7.5 x 7.5 minute,
7_5_Min,
Combined Vector,
Combined Vector,
Combined Vector,
Layers of geospatial data include contours, boundaries, land cover, hydrography, roads, transportation, geographic names, structures, and other selected map features.
Types: Citation;
Tags: 7.5 x 7.5 minute,
7_5_Min,
Combined Vector,
Combined Vector,
Combined Vector,
Layers of geospatial data include contours, boundaries, land cover, hydrography, roads, transportation, geographic names, structures, and other selected map features.
Types: Citation;
Tags: 7.5 x 7.5 minute,
7_5_Min,
Combined Vector,
Combined Vector,
Combined Vector,
Layers of geospatial data include contours, boundaries, land cover, hydrography, roads, transportation, geographic names, structures, and other selected map features.
Layers of geospatial data include contours, boundaries, land cover, hydrography, roads, transportation, geographic names, structures, and other selected map features.
|

|
