Filters: Tags: Westchester County (X)
58 results (91ms)|
Filters
Contacts
(Less)
|
Layered geospatial PDF 7.5 Minute Quadrangle Map. Layers of geospatial data include orthoimagery, roads, grids, geographic names, elevation contours, hydrography, and other selected map features. This map is derived from GIS (geospatial information system) data. It represents a repackaging of GIS data in traditional map form, not creation of new information. The geospatial data in this map are from selected National Map data holdings and other government sources.
Layered geospatial PDF 7.5 Minute Quadrangle Map. Layers of geospatial data include orthoimagery, roads, grids, geographic names, elevation contours, hydrography, and other selected map features. This map is derived from GIS (geospatial information system) data. It represents a repackaging of GIS data in traditional map form, not creation of new information. The geospatial data in this map are from selected National Map data holdings and other government sources.
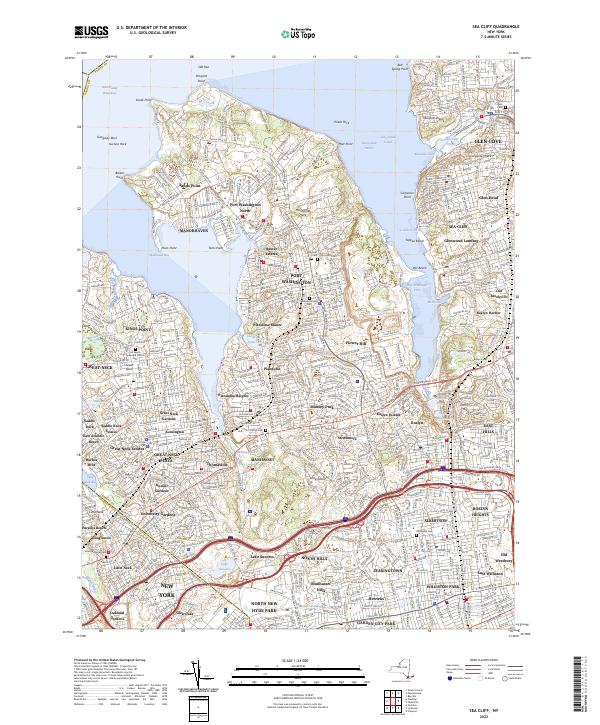
Layered geospatial PDF 7.5 Minute Quadrangle Map. Layers of geospatial data include orthoimagery, roads, grids, geographic names, elevation contours, hydrography, and other selected map features. This map is derived from GIS (geospatial information system) data. It represents a repackaging of GIS data in traditional map form, not creation of new information. The geospatial data in this map are from selected National Map data holdings and other government sources.
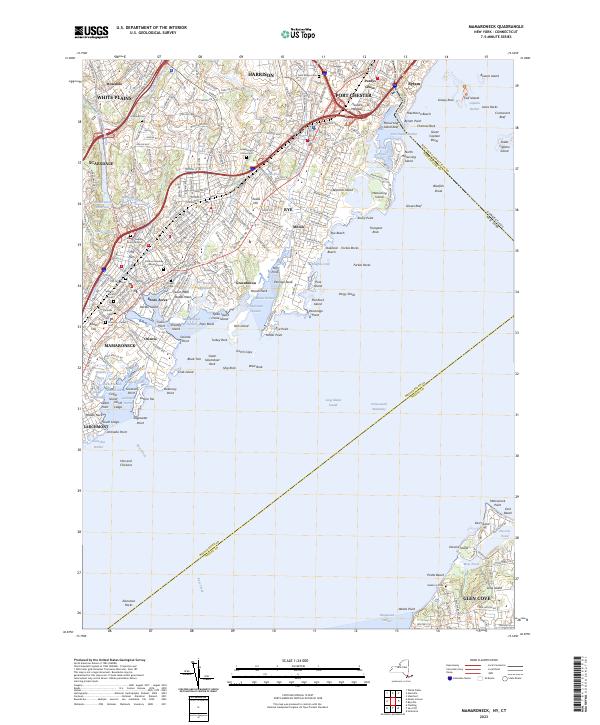
Layered geospatial PDF 7.5 Minute Quadrangle Map. Layers of geospatial data include orthoimagery, roads, grids, geographic names, elevation contours, hydrography, and other selected map features. This map is derived from GIS (geospatial information system) data. It represents a repackaging of GIS data in traditional map form, not creation of new information. The geospatial data in this map are from selected National Map data holdings and other government sources.
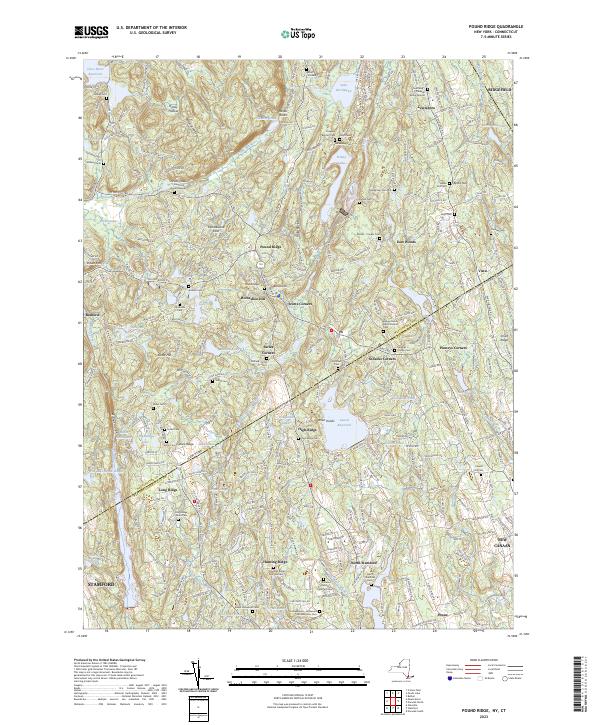
Layered geospatial PDF 7.5 Minute Quadrangle Map. Layers of geospatial data include orthoimagery, roads, grids, geographic names, elevation contours, hydrography, and other selected map features. This map is derived from GIS (geospatial information system) data. It represents a repackaging of GIS data in traditional map form, not creation of new information. The geospatial data in this map are from selected National Map data holdings and other government sources.
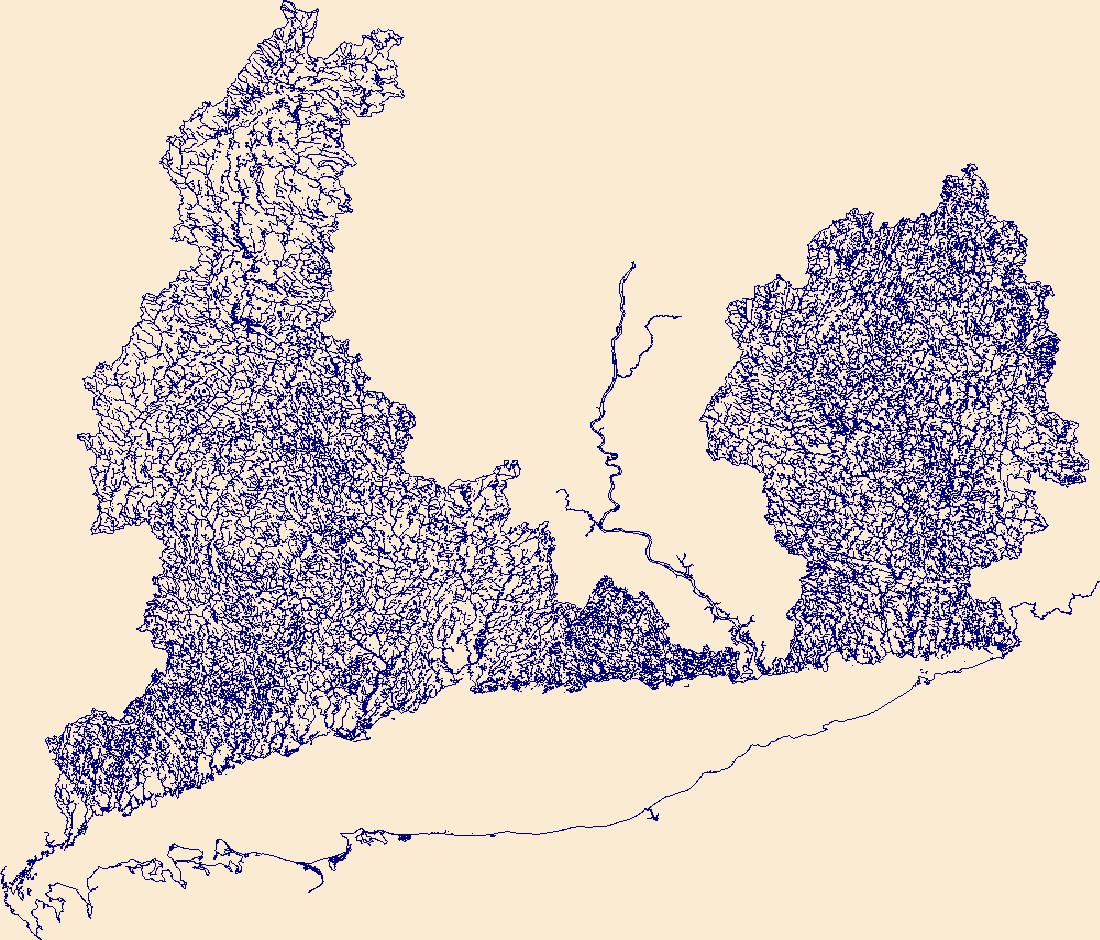
The High Resolution National Hydrography Dataset Plus (NHDPlus HR) is an integrated set of geospatial data layers, including the National Hydrography Dataset (NHD), National Watershed Boundary Dataset (WBD), and 3D Elevation Program Digital Elevation Model (3DEP DEM). The NHDPlus HR combines the NHD, 3DEP DEMs, and WBD to a data suite that includes the NHD stream network with linear referencing functionality, the WBD hydrologic units, elevation-derived catchment areas for each stream segment, "value added attributes" (VAAs), and other features that enhance hydrologic data analysis and routing.
From May 2017 to November 2019, the U.S. Geological Survey conducted bathymetric surveys of New York City's East of Hudson Reservoirs. Bathymetry data were collected at New Croton Reservoir during June 2017, July 2017, and October 2017. Depth data were collected primarily with a multibeam echosounder. Quality assurance points were measured with a single-beam echosounder. Water surface elevations were established using real-time kinematic (RTK) and static global navigation satellite system (GNSS) surveys and submersible pressure transducers. Measured sound velocity profiles were used to correct echosounder depth measurements for thermal stratification. Digital elevation models were created by combining the measured...
Categories: Data;
Types: Downloadable,
GeoTIFF,
Map Service,
OGC WFS Layer,
OGC WMS Layer,
Raster,
Shapefile;
Tags: Ambient Monitoring,
Basin & Hydrogeologic Characterization,
New Croton Reservoir,
New York,
Water Use and Availability Science,
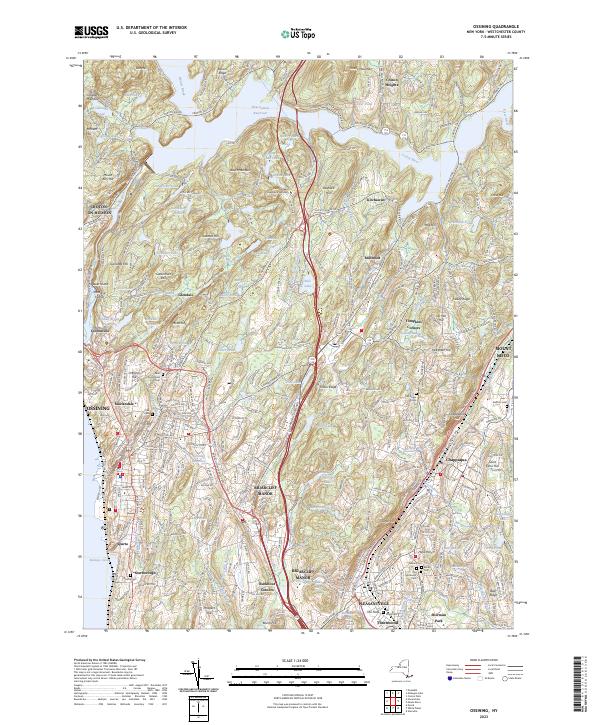
Layered geospatial PDF 7.5 Minute Quadrangle Map. Layers of geospatial data include orthoimagery, roads, grids, geographic names, elevation contours, hydrography, and other selected map features. This map is derived from GIS (geospatial information system) data. It represents a repackaging of GIS data in traditional map form, not creation of new information. The geospatial data in this map are from selected National Map data holdings and other government sources.
This data release contains coastal wetland synthesis products for the geographic region of Hudson Valley and New York City, New York. Metrics for resiliency, including unvegetated to vegetated ratio (UVVR), marsh elevation, and mean tidal range, are calculated for smaller units delineated from a Digital Elevation Model, providing the spatial variability of physical factors that influence wetland health. Through scientific efforts initiated with the Hurricane Sandy Science Plan, the U.S. Geological Survey has been expanding national assessment of coastal change hazards and forecast products to coastal wetlands with the intent of providing Federal, State, and local managers with tools to estimate the vulnerability...
Categories: Data;
Types: Downloadable,
Map Service,
OGC WFS Layer,
OGC WMS Layer,
Shapefile;
Tags: Dutchess County,
Hudson River,
LTER,
Long-Term Ecological Research,
Lower Bay,
Layered geospatial PDF 7.5 Minute Quadrangle Map. Layers of geospatial data include orthoimagery, roads, grids, geographic names, elevation contours, hydrography, and other selected map features. This map is derived from GIS (geospatial information system) data. It represents a repackaging of GIS data in traditional map form, not creation of new information. The geospatial data in this map are from selected National Map data holdings and other government sources.
From May 2017 to November 2019, the U.S. Geological Survey conducted bathymetric surveys of New York City's East of Hudson Reservoirs. Bathymetry data were collected at Amawalk Reservoir from May 2018 to November 2019. Depth data were collected primarily with a multibeam echosounder. Quality assurance points were measured with a single-beam echosounder. Water surface elevations were established using real-time kinematic (RTK) and static global navigation satellite system (GNSS) surveys and submersible pressure transducers. Measured sound velocity profiles were used to correct echosounder depth measurements for thermal stratification. Digital elevation models were created by combining the measured bathymetry data...
Categories: Data;
Types: Downloadable,
GeoTIFF,
Map Service,
OGC WFS Layer,
OGC WMS Layer,
Raster,
Shapefile;
Tags: Amawalk Reservoir,
Ambient Monitoring,
Basin & Hydrogeologic Characterization,
New York,
Water Use and Availability Science,
From July through November 2018, 48 environmental samples and four quality-control samples were collected throughout the Lower Hudson, Chemung, and Eastern Lake Ontario River Basins. Samples were collected from seven production wells and eight domestic wells in the Eastern Lake Ontario Basin, 13 production wells and 12 domestic wells in the Lower Hudson River Basin, and four production wells and four domestic wells in the Chemung River Basin. Of the wells sampled, 27 were completed in bedrock and 21 were completed in sand and gravel. Approximately 20 percent of samples were collected from wells that were previously sampled in 2003, 2008, and 2013. Groundwater samples were collected prior to any treatment or filtration...
Categories: Data;
Types: Map Service,
OGC WFS Layer,
OGC WMS Layer,
OGC WMS Service;
Tags: Albany County,
Allegany County,
Ambient Monitoring,
Chemung County,
Chemung River Basin,
This data release contains water level displacement data and analytical type-curve matches for selected hydraulic tests that support USGS Open-File Report 2019-1102, "Slug-test analysis of selected wells at an earthen dam site in southern Westchester County, New York." In 2005, the U.S. Geological Survey began a cooperative study with New York City Department of Environmental Protection (NYCDEP) to characterize the local groundwater-flow system and identify potential sources of seeps on the southern embankment of the Hillview Reservoir in southern Westchester County, New York. The earthen embankment comprises low-permeability glacial clays that were excavated from the site and rest on a veneer of low-permeability...
Categories: Data;
Types: ArcGIS REST Map Service,
ArcGIS Service Definition,
Downloadable,
Map Service;
Tags: Bronx County,
HVR,
Hillview Reservoir,
Hillview Reservoir,
Hillview Reservoir; hydraulic test; groundwater,
This folder contains analytical type-curve matches for selected hydraulic tests that support USGS Open-File Report 2019-1102, "Slug-test analysis of selected wells at an earthen dam site in southern Westchester County, New York." In 2005, the U.S. Geological Survey began a cooperative study with New York City Department of Environmental Protection (NYCDEP) to characterize the local groundwater-flow system and identify potential sources of seeps on the southern embankment of the Hillview Reservoir in southern Westchester County, New York. The earthen embankment comprises low-permeability glacial clays that were excavated from the site and rest on a veneer of low-permeability glacial deposits that overlie crystalline...
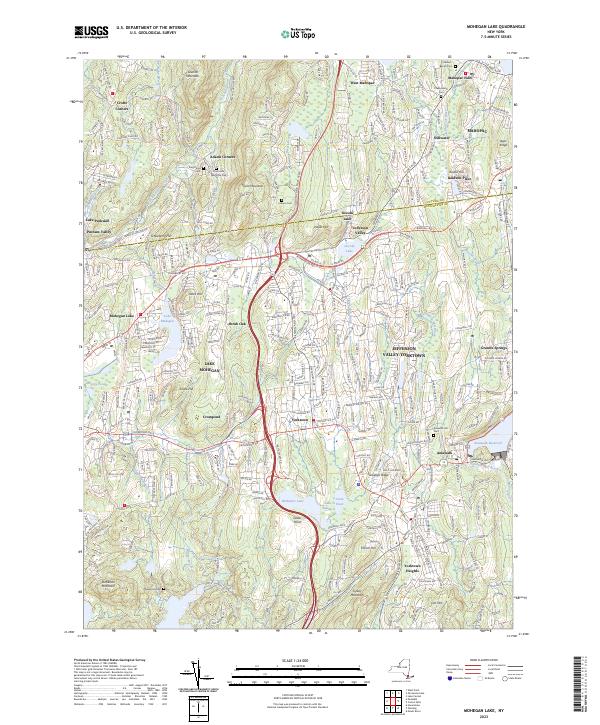
Layered geospatial PDF 7.5 Minute Quadrangle Map. Layers of geospatial data include orthoimagery, roads, grids, geographic names, elevation contours, hydrography, and other selected map features. This map is derived from GIS (geospatial information system) data. It represents a repackaging of GIS data in traditional map form, not creation of new information. The geospatial data in this map are from selected National Map data holdings and other government sources.
Layered geospatial PDF 7.5 Minute Quadrangle Map. Layers of geospatial data include orthoimagery, roads, grids, geographic names, elevation contours, hydrography, and other selected map features. This map is derived from GIS (geospatial information system) data. It represents a repackaging of GIS data in traditional map form, not creation of new information. The geospatial data in this map are from selected National Map data holdings and other government sources.
From May 2017 to November 2019, the U.S. Geological Survey conducted bathymetry surveys of New York City's East of Hudson Reservoirs. The East of Hudson Reservoirs consist of 16 reservoirs and controlled lakes in Putnam and Westchester County, New York, including Amawalk Reservoir, Bog Brook Reservoir, Boyd Corners Reservoir, Cross River Reservoir, Croton Falls Reservoir, Diverting Reservoir, East Branch Reservoir, Kensico Reservoir, Kirk Lake, Lake Gilead, Lake Gleneida, Middle Branch Reservoir, Muscoot Reservoir, New Croton Reservoir, Titicus Reservoir, and West Branch Reservoir. The East of Hudson Reservoirs form New York City's Croton Water Supply System, and also include parts of the Catskill/Delaware Water...
This data release contains coastal wetland synthesis products for the geographic region of Hudson Valley and New York City, New York. Metrics for resiliency, including unvegetated to vegetated ratio (UVVR), marsh elevation, and mean tidal range, are calculated for smaller units delineated from a Digital Elevation Model, providing the spatial variability of physical factors that influence wetland health. Through scientific efforts initiated with the Hurricane Sandy Science Plan, the U.S. Geological Survey has been expanding national assessment of coastal change hazards and forecast products to coastal wetlands with the intent of providing Federal, State, and local managers with tools to estimate the vulnerability...
Categories: Data;
Types: Downloadable,
Map Service,
OGC WFS Layer,
OGC WMS Layer,
Shapefile;
Tags: Dutchess County,
Hudson River,
LTER,
Long-Term Ecological Research,
Lower Bay,
This data release contains coastal wetland synthesis products for the geographic region of Hudson Valley and New York City, New York. Metrics for resiliency, including unvegetated to vegetated ratio (UVVR), marsh elevation, mean tidal range, and shoreline change rate are calculated for smaller units delineated from a Digital Elevation Model, providing the spatial variability of physical factors that influence wetland health. Through scientific efforts initiated with the Hurricane Sandy Science Plan, the U.S. Geological Survey has been expanding national assessment of coastal change hazards and forecast products to coastal wetlands with the intent of providing Federal, State, and local managers with tools to estimate...
Categories: Data;
Types: Downloadable,
Map Service,
OGC WFS Layer,
OGC WMS Layer,
Shapefile;
Tags: Dutchess County,
Hudson River,
Lower Bay,
New York,
Putnam County,
|

|
