Filters: Tags: Will County (X) > partyWithName: U.S. Geological Survey (X)
142 results (107ms)|
Filters
Contacts
(Less)
|
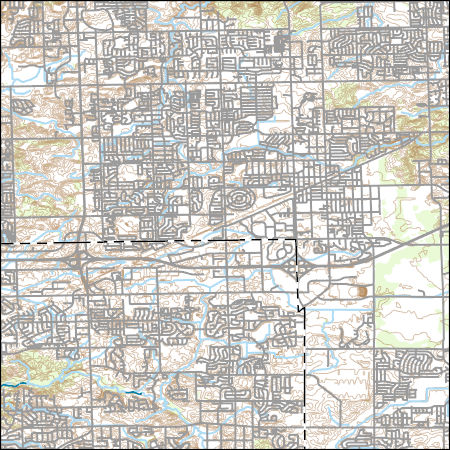
Layers of geospatial data include contours, boundaries, land cover, hydrography, roads, transportation, geographic names, structures, and other selected map features.
Types: Citation;
Tags: 7.5 x 7.5 minute,
7.5 x 7.5 minute,
Combined Vector,
Combined Vector,
Combined Vector,
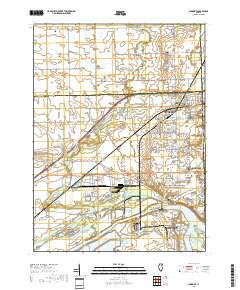
Layered geospatial PDF 7.5 Minute Quadrangle Map. Layers of geospatial data include orthoimagery, roads, grids, geographic names, elevation contours, hydrography, and other selected map features. This map is derived from GIS (geospatial information system) data. It represents a repackaging of GIS data in traditional map form, not creation of new information. The geospatial data in this map are from selected National Map data holdings and other government sources.
Layered geospatial PDF 7.5 Minute Quadrangle Map. Layers of geospatial data include orthoimagery, roads, grids, geographic names, elevation contours, hydrography, and other selected map features. This map is derived from GIS (geospatial information system) data. It represents a repackaging of GIS data in traditional map form, not creation of new information. The geospatial data in this map are from selected National Map data holdings and other government sources.
Layered geospatial PDF 7.5 Minute Quadrangle Map. Layers of geospatial data include orthoimagery, roads, grids, geographic names, elevation contours, hydrography, and other selected map features. This map is derived from GIS (geospatial information system) data. It represents a repackaging of GIS data in traditional map form, not creation of new information. The geospatial data in this map are from selected National Map data holdings and other government sources.
Layered geospatial PDF 7.5 Minute Quadrangle Map. Layers of geospatial data include orthoimagery, roads, grids, geographic names, elevation contours, hydrography, and other selected map features. This map is derived from GIS (geospatial information system) data. It represents a repackaging of GIS data in traditional map form, not creation of new information. The geospatial data in this map are from selected National Map data holdings and other government sources.
These data were collected using a 1200 kHz TRDI Rio Grande acoustic Doppler current profiler (ADCP) in mode 12 with 25 centimeter bins from a moving boat. The data were georeferenced with a Hemisphere V102 differential Global Positioning System (GPS) receiver with submeter accuracy. The data were processed in the Velocity Mapping Toolbox (Parsons and others, 2013) to obtain a mean velocity field for each cross section from individual transects at each cross section. These data were collected in support of the US Army Corps of Engineers Great Lakes and Mississippi River Interbasin Study (GLMRIS), and were concurrent with a dye-tracing study. NOTE: Any data assigned a value of "-9999" are invalid or missing data and...
Types: Citation;
Tags: Brandon Road Lock and Dam,
Des Plaines River,
Illinois,
Velocity,
Will County
Data include Rhodamine WT dye concentrations measured every 3 or 10 minutes by means of Turner Designs C-3 and C-6 fluorometers with internal dataloggers at three fixed locations on the Des Plaines River (DPR) (DP-1, DP-2, and DP-3); in three groundwater monitoring wells (ACL-1, WP10-85, and WP9-275); and at two fixed locations on the Chicago Sanitary and Ship Canal (CSSC) (SC-1 and SC-2) (see included Google Earth file AllDeployments_Locations.kmz). The detection limit for these fluorometers is reported to be 0.01 parts per billion (ppb). However, the fluorometer readings were affected by turbidity, and readings of less than about 1.0 part per billion (ppb) were considered to have been influenced by turbidity and...
Categories: Data;
Types: Citation,
Map Service,
OGC WFS Layer,
OGC WMS Layer,
OGC WMS Service;
Tags: Chicago Sanitary and Ship Canal,
Cook County,
Des Plaines River,
DuPage County,
Dye,
In 2017, the U.S. Fish and Wildlife Service, U.S. Geological Survey, and U.S. Army Corps of Engineers undertook a large-scale interagency field study to determine the influence of commercial barge vessels on the efficacy of the Electric Dispersal Barrier System (EDBS) in the Chicago Sanitary and Ship Canal (CSSC) in preventing fish passage. This study included a series of trials in which a tow, consisting of a tug vessel and fully-loaded barges, transited the EDBS in both upstream-bound (n = 65) and downstream-bound (n = 66) directions. A 600 kHz Teledyne RDI Channel Master Acoustic Doppler Velocity Meter (ADVM), was mounted on the west canal wall at a depth of approximately 5.5 feet (1.7 meters), as measured on...
In 2017, the U.S. Fish and Wildlife Service, U.S. Geological Survey, and U.S. Army Corps of Engineers undertook a large-scale interagency field study to determine the influence of commercial barge vessels on the efficacy of the Electric Dispersal Barrier System (EDBS) in the Chicago Sanitary and Ship Canal (CSSC) in preventing fish passage. This study included a series of trials in which a tow, consisting of a tug vessel and fully-loaded barges, transited the EDBS in both upstream-bound (n = 65) and downstream-bound (n = 66) directions. The configuration of the barges for each run is provided in 2017_Run_Information.csv. A 3000 kHz SonTek Argonaut SW Acoustic Doppler Velocity Meter (ADVM), was mounted on the west...
Water temperature (degrees Celsius) and specific conductance (microsiemens per centimeter at 25 degrees Celsius; TC) were measured at U.S. Geological Survey streamgage 05536995, located at Chicago Sanitary and Ship Canal near the Electrical Dispersal Barrier System in Romeoville, Illinois. The TC data were measured every five minutes at four gage height levels above the gage datum (P1 = 21 feet, P2 = 17 feet, P3 = 13 feet, P4 = 9 feet). The gage datum is 551.76 feet above the North American Vertical Datum of 1988 (NAVD 88). Daily mean and five-minutes water temperature and specific conductance data were downloaded from the National Water Information System (NWIS) database and stored in Comma Separated Values (CSV)...
Categories: Data;
Tags: Chicago Sanitary and Ship Canal,
Illinois,
Romeoville,
Will County,
specific conductance,
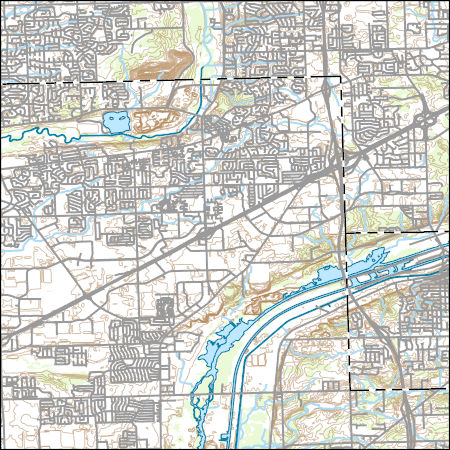
Layers of geospatial data include contours, boundaries, land cover, hydrography, roads, transportation, geographic names, structures, and other selected map features.
Types: Citation;
Tags: 7.5 x 7.5 minute,
7.5 x 7.5 minute,
Combined Vector,
Combined Vector,
Combined Vector,
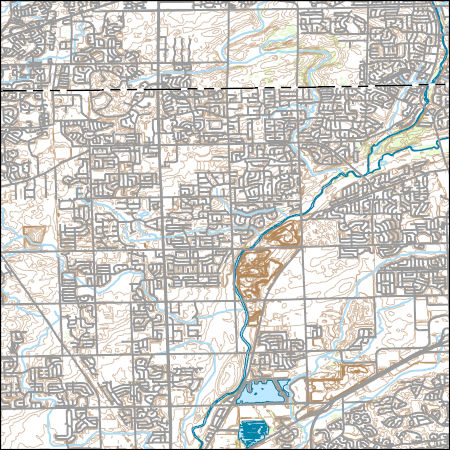
Layers of geospatial data include contours, boundaries, land cover, hydrography, roads, transportation, geographic names, structures, and other selected map features.
Types: Citation;
Tags: 7.5 x 7.5 minute,
7.5 x 7.5 minute,
Combined Vector,
Combined Vector,
Combined Vector,
Layers of geospatial data include contours, boundaries, land cover, hydrography, roads, transportation, geographic names, structures, and other selected map features.
Types: Citation;
Tags: 7.5 x 7.5 minute,
7.5 x 7.5 minute,
Combined Vector,
Combined Vector,
Combined Vector,
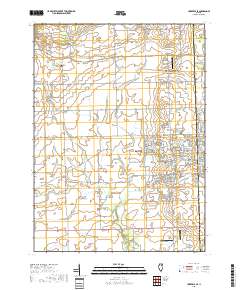
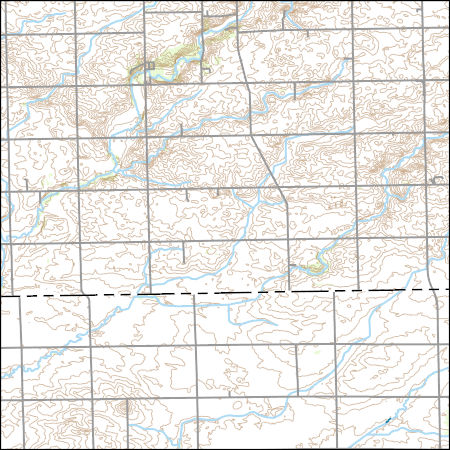
USGS Topo Map Vector Data (Vector) 70003 Elwood, Illinois 20210628 for 7.5 x 7.5 minute FileGDB 10.1
Layers of geospatial data include contours, boundaries, land cover, hydrography, roads, transportation, geographic names, structures, and other selected map features.
Types: Citation;
Tags: 7.5 x 7.5 minute,
7.5 x 7.5 minute,
Combined Vector,
Combined Vector,
Combined Vector,
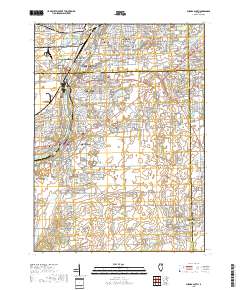
USGS Topo Map Vector Data (Vector) 27458 Manhattan, Illinois 20210629 for 7.5 x 7.5 minute Shapefile
Layers of geospatial data include contours, boundaries, land cover, hydrography, roads, transportation, geographic names, structures, and other selected map features.
Types: Citation;
Tags: 7.5 x 7.5 minute,
7.5 x 7.5 minute,
Combined Vector,
Combined Vector,
Combined Vector,
Layers of geospatial data include contours, boundaries, land cover, hydrography, roads, transportation, geographic names, structures, and other selected map features.
Types: Citation;
Tags: 7.5 x 7.5 minute,
7.5 x 7.5 minute,
Combined Vector,
Combined Vector,
Combined Vector,
Layers of geospatial data include contours, boundaries, land cover, hydrography, roads, transportation, geographic names, structures, and other selected map features.
Types: Citation;
Tags: 7.5 x 7.5 minute,
7.5 x 7.5 minute,
Combined Vector,
Combined Vector,
Combined Vector,
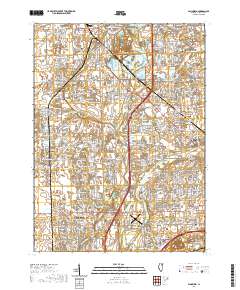
Layered geospatial PDF 7.5 Minute Quadrangle Map. Layers of geospatial data include orthoimagery, roads, grids, geographic names, elevation contours, hydrography, and other selected map features. This map is derived from GIS (geospatial information system) data. It represents a repackaging of GIS data in traditional map form, not creation of new information. The geospatial data in this map are from selected National Map data holdings and other government sources.
Layered geospatial PDF 7.5 Minute Quadrangle Map. Layers of geospatial data include orthoimagery, roads, grids, geographic names, elevation contours, hydrography, and other selected map features. This map is derived from GIS (geospatial information system) data. It represents a repackaging of GIS data in traditional map form, not creation of new information. The geospatial data in this map are from selected National Map data holdings and other government sources.
Layered geospatial PDF 7.5 Minute Quadrangle Map. Layers of geospatial data include orthoimagery, roads, grids, geographic names, elevation contours, hydrography, and other selected map features. This map is derived from GIS (geospatial information system) data. It represents a repackaging of GIS data in traditional map form, not creation of new information. The geospatial data in this map are from selected National Map data holdings and other government sources.
|

|
