Filters: Tags: Willimantic, CT (X)
4 results (111ms)|
Filters
Date Range
Contacts (Less)
Categories (Less) Tag Types Tag Schemes
|
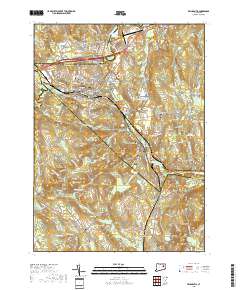
Layered geospatial PDF 7.5 Minute Quadrangle Map. Layers of geospatial data include orthoimagery, roads, grids, geographic names, elevation contours, hydrography, and other selected map features. This map is derived from GIS (geospatial information system) data. It represents a repackaging of GIS data in traditional map form, not creation of new information. The geospatial data in this map are from selected National Map data holdings and other government sources.
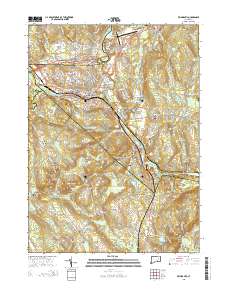
Layered GeoPDF 7.5 Minute Quadrangle Map. Layers of geospatial data include orthoimagery, roads, grids, geographic names, elevation contours, hydrography, and other selected map features.
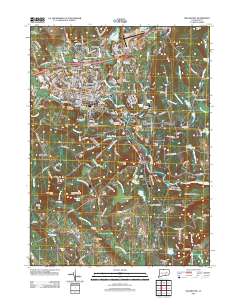
Layered GeoPDF 7.5 Minute Quadrangle Map. Layers of geospatial data include orthoimagery, roads, grids, geographic names, elevation contours, hydrography, and other selected map features.
This data release provides data in support of an assessment of changes in slope of the concentration-discharge relation for total organic carbon in eight major rivers at gaging stations in Connecticut from October 1972 to September 2019 (U.S. Geological Survey water years 1973 to 2019). The rivers include the Connecticut at Thompsonville (01184000), Housatonic at Stevenson (01205500), Quinebaug at Jewett City (01127000), Farmington at Tariffville (01189995), Shetucket at Willamantic (01122500), Naugatuck at Beacon Falls (011208500), Quinnipiac at Wallingford (01196500), and Salmon at East Hampton (01193500). The assessment is described in the article “An increase in the slope of the concentration discharge relation...
Categories: Data;
Tags: Beacon Falls, CT,
Connecticut River,
East Hampton, CT,
Farmington River,
Housatonic River,
|

|
