Filters: Tags: ecosystem (X)
325 results (23ms)|
Filters
Date Range
Extensions Types Contacts
Categories Tag Types Tag Schemes |
The Great Plains Landscape Conservation Cooperative (GPLCC, https://www.fws.gov/science/catalog) is a partnership that provides applied science and decision support tools to assist natural resource managers conserve plants, fish and wildlife in the mid- and short-grass prairie of the southern Great Plains. It is part of a national network of public-private partnerships — known as Landscape Conservation Cooperatives (LCCs, http://www.fws.gov/science/shc/lcc.html) — that work collaboratively across jurisdictions and political boundaries to leverage resources and share science capacity. The Great Plains LCC identifies science priorities for the region and helps foster science that addresses these priorities to support...
Categories: Data;
Types: Downloadable,
GeoTIFF,
Map Service,
Raster;
Tags: GPLCC,
Great Plains Landscape Conservation Cooperative,
bioclimate,
biogeography,
biophysical stratification,
This part of DS 781 presents data for the habitat map of the seafloor of the Offshore of Monterey map area, California. The vector data file is included in "Habitat_OffshoreMonterey.zip," which is accessible from https://doi.org/10.5066/F70Z71C8. These data accompany the pamphlet and map sheets of Johnson, S.Y., Dartnell, P., Hartwell, S.R., Cochrane, G.R., Golden, N.E., Watt, J.T., Davenport, C.W., Kvitek, R.G., Erdey, M.D., Krigsman, L.M., Sliter, R.W., and Maier, K.L. (S.Y. Johnson and S.A. Cochran, eds.), 2016, California State Waters Map Series—Offshore of Monterey, California: U.S. Geological Survey Open-File Report 2016–1110, pamphlet 44 p., 10 sheets, scale 1:24,000, https://doi.org/10.3133/ofr20161110....
Categories: Data;
Types: Citation,
Downloadable,
Map Service,
OGC WFS Layer,
OGC WMS Layer,
Shapefile;
Tags: Backscatter,
Bathymetry,
Bathymetry,
CMHRP,
Coastal and Marine Hazards and Resources Program,
This part of the Oregon OCS Data Release presents geological observations from video collected on cruise 2014-607-FA in the Floating Wind Farm survey area. The survey was conducted using 12 hour day operations out of Charleston Harbor near Coos Bay, Oregon. The cruise plan consisted of 23 days on site split between sonar mapping and video ground truth surveying. Activities parsed out to nine days of sonar mapping, three days of video surveying, eight days of no operations due to weather, and three days mobilizing and demobilizing (table 1). Typically the Snavely would transit out to the survey area in an hour at a speed of 20 knots. Marine Mammal observations were made during the multibeam sonar mapping portion...
There are 3 downloadable products in this item. The map package contains the footprint of the Southern Rockies Landscape Conservation Cooperative, showing level III ecoregions as defined by James Omernik (see metadata for citations). From metadata: "Ecoregions denote areas of general similarity in ecosystems and in the type, quality, and quantity of environmental resources. They are designed to serve as a spatial framework for the research, assessment, management, and monitoring of ecosystems and ecosystem components. A Roman numeral hierarchical scheme has been adopted for different levels for ecological regions." Level I is the coursest division and level IV is the finest. The GIF file shows the SRLCC footprint...
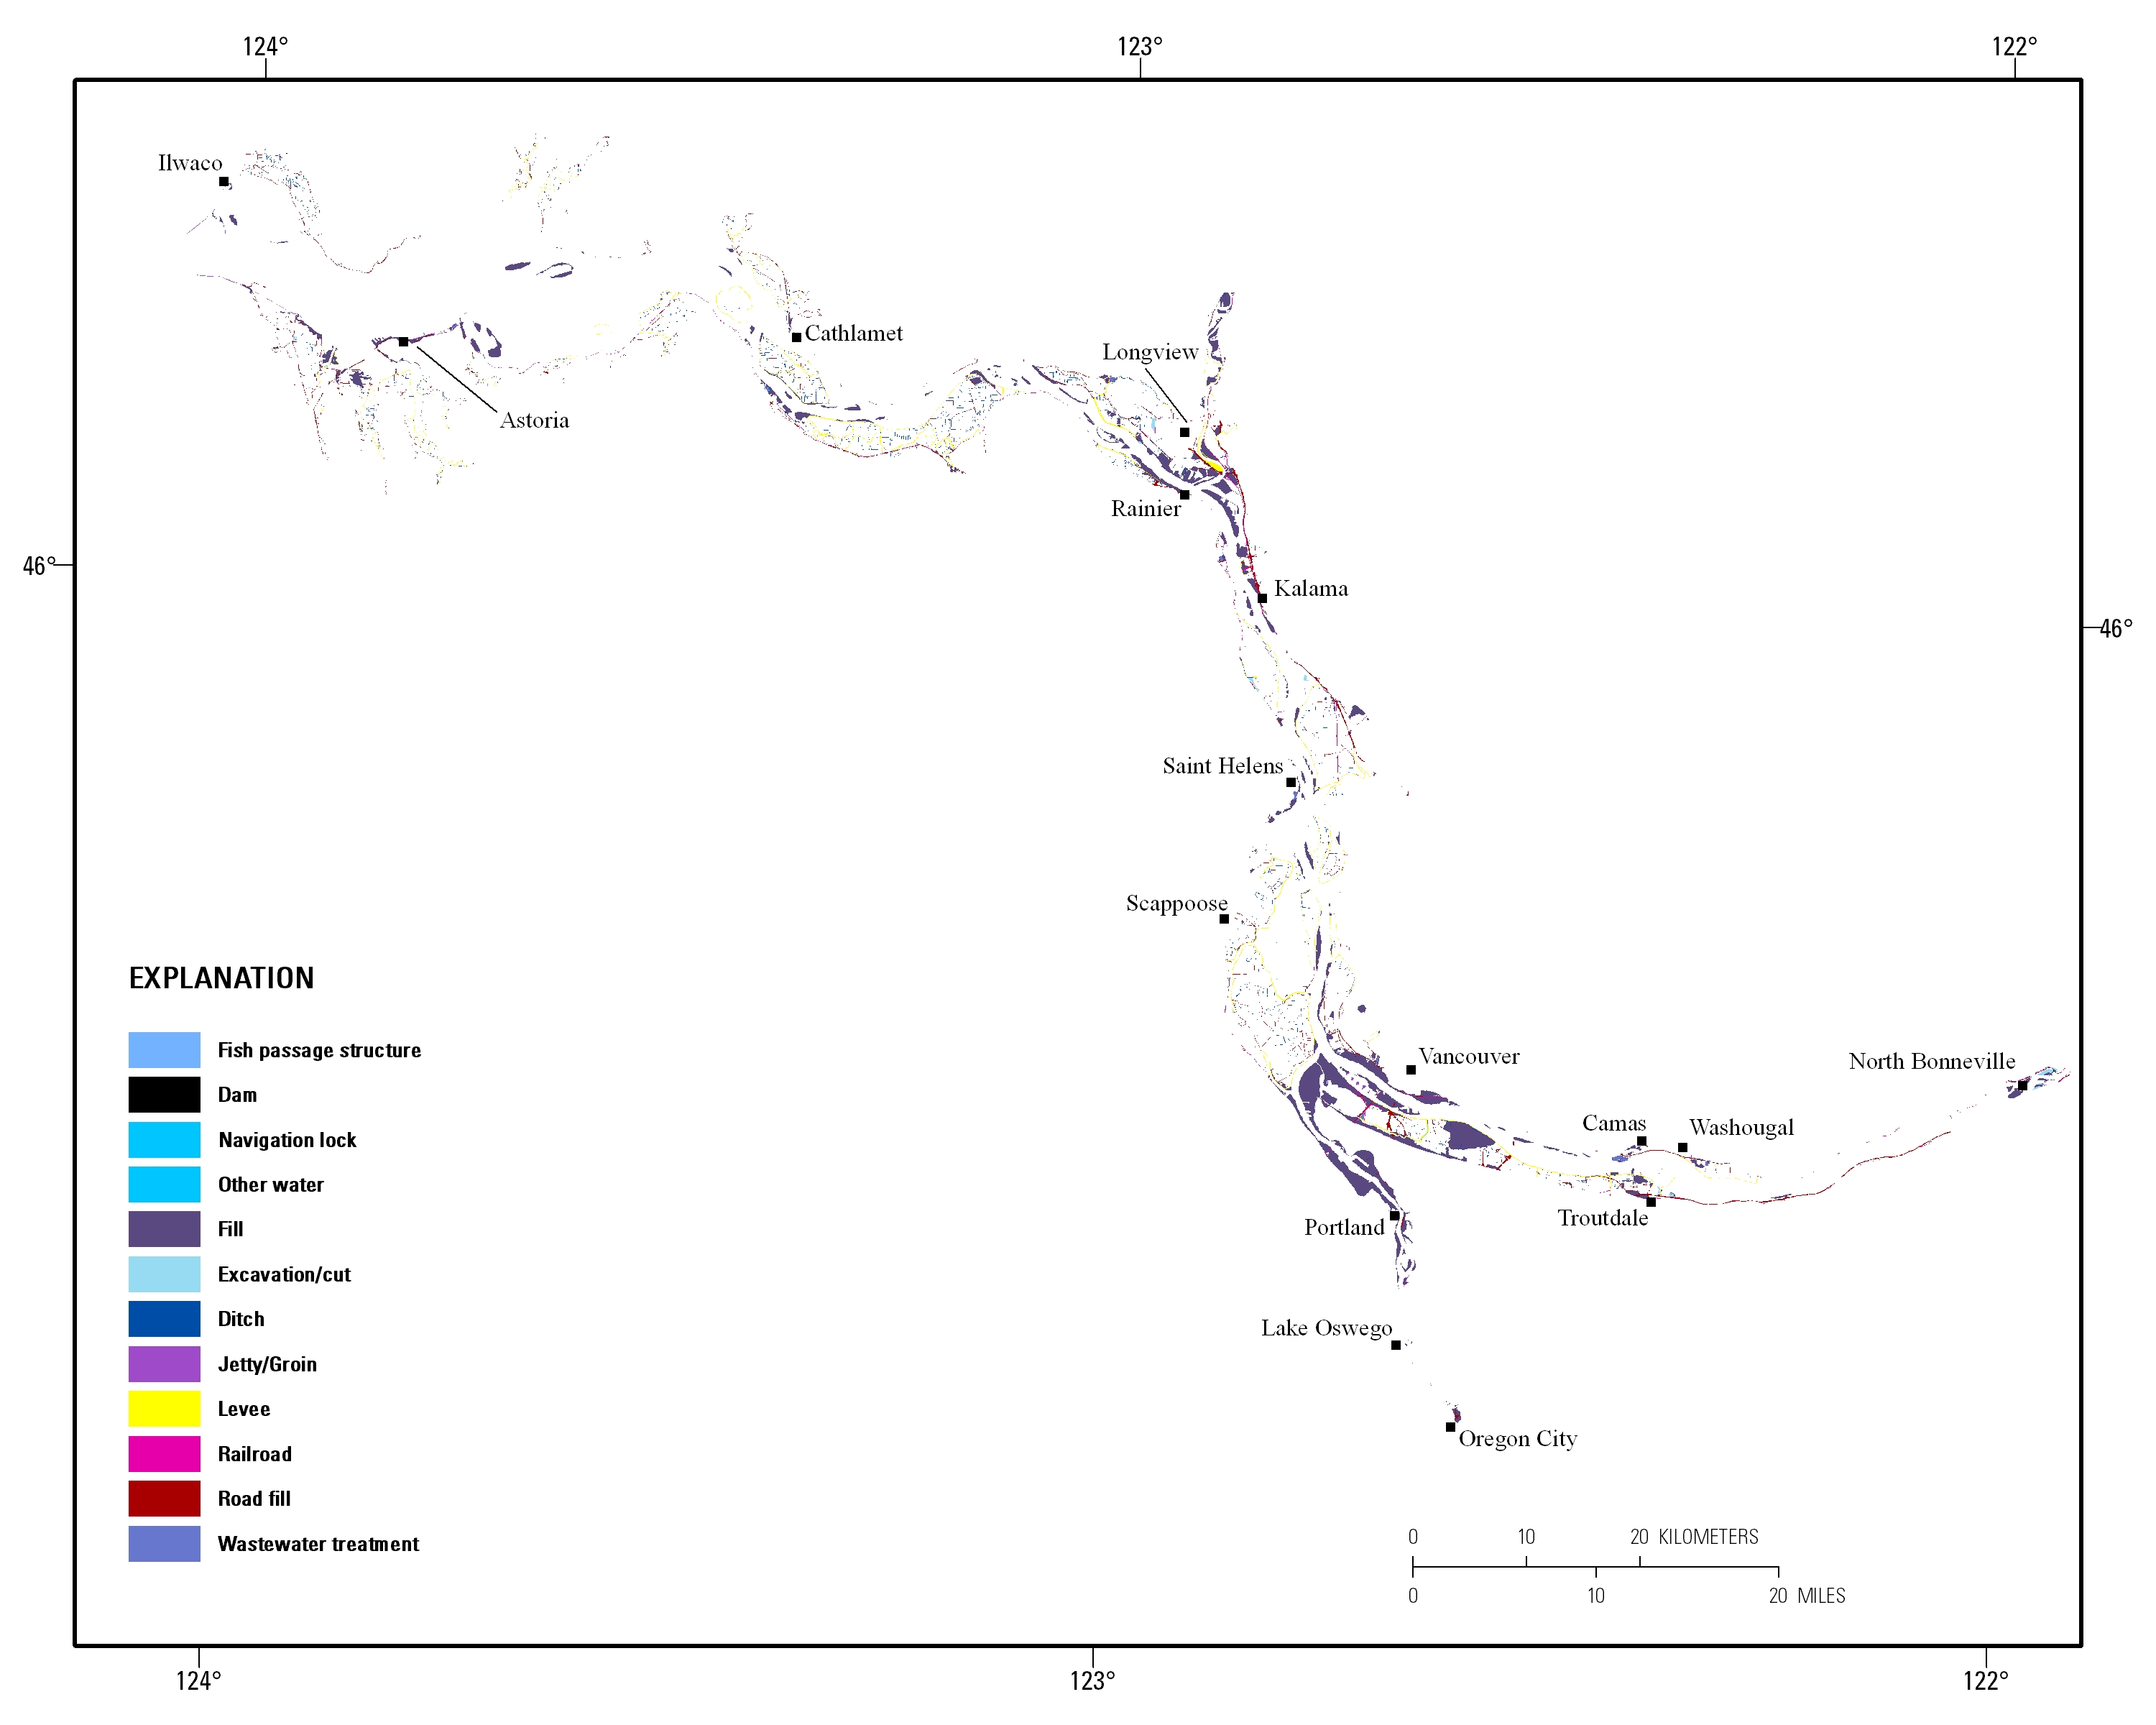
Estuarine ecosystems are controlled by a variety of processes that operate at multiple spatial and temporal scales. Understanding the hierarchical nature of these processes will aid in prioritization of restoration efforts. This hierarchical Columbia River Estuary Ecosystem Classification (henceforth "Classification") of the Columbia River estuary is a spatial database of the tidally-influenced reaches of the lower Columbia River, the tidally affected parts of its tributaries, and the landforms that make up their floodplains for the 230 kilometers between the Pacific Ocean and Bonneville Dam. This work is a collaborative effort between University of Washington School of Aquatic and Fishery Sciences (henceforth "UW"),...
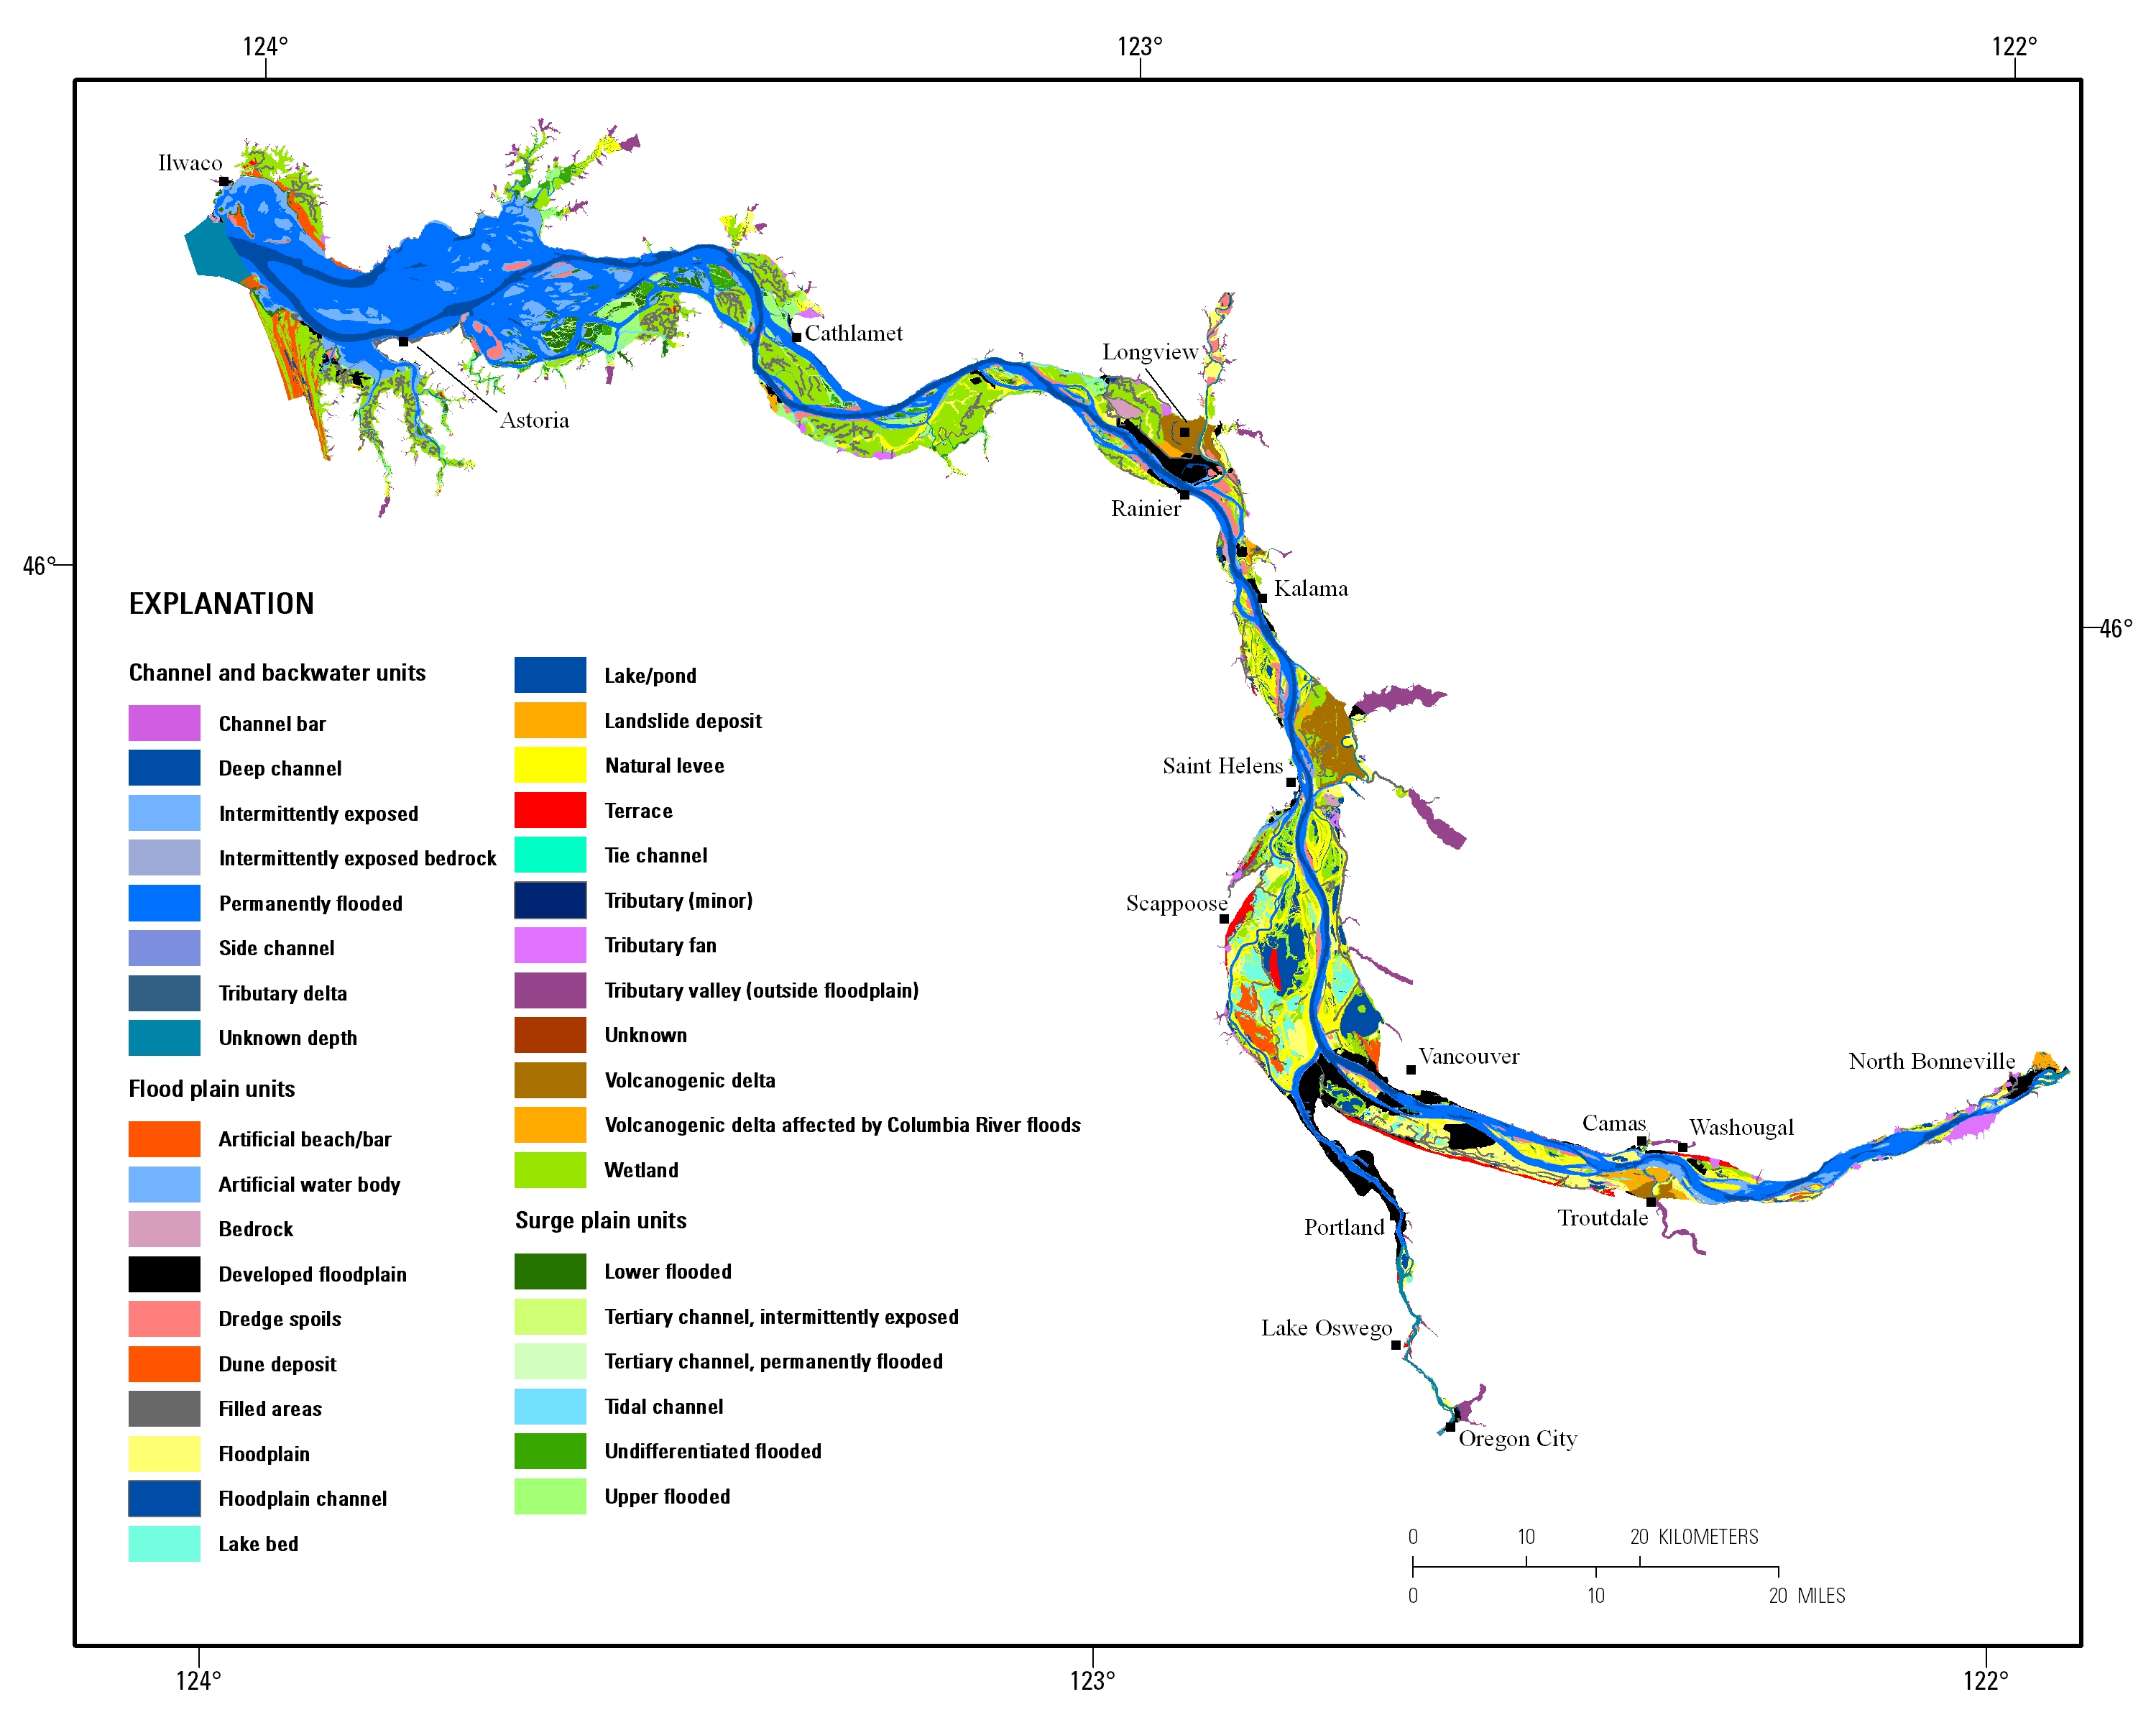
Estuarine ecosystems are controlled by a variety of processes that operate at multiple spatial and temporal scales. Understanding the hierarchical nature of these processes will aid in prioritization of restoration efforts. This hierarchical Columbia River Estuary Ecosystem Classification (henceforth "Classification") of the Columbia River estuary is a spatial database of the tidally-influenced reaches of the lower Columbia River, the tidally affected parts of its tributaries, and the landforms that make up their floodplains for the 230 kilometers between the Pacific Ocean and Bonneville Dam. This work is a collaborative effort between University of Washington School of Aquatic and Fishery Sciences (henceforth "UW"),...
In California, increased wildfire activity has been linked to decreasing snowpack and earlier snowmelt. Not only has this translated into a longer fire season, but reduced snowpack has cascading effects that impact streamflow, water supplies, agricultural productivity, and ecosystems. California receives 80% of its precipitation during the winter, so mountain snowpack plays a critical role in replenishing the state’s water supply. One factor that affects the amount of winter precipitation (and therefore snowpack) in California is the North Pacific Jet (NPJ)—a current of strong, high altitude winds that occur over the northern Pacific Ocean. Winters when the NPJ is located further north than normal are drier than...
Categories: Project;
Types: Map Service,
OGC WFS Layer,
OGC WMS Layer,
OGC WMS Service,
Report;
Tags: 2013,
CA,
CA-wide,
CASC,
Completed,
The U.S. Geological Survey (USGS) has generated and mapped isobioclimate classes for the contiguous United States. These isobioclimate classes were created as part of an effort to map standardized, terrestrial ecosystems for the nation using a classification developed by NatureServe (Comer and others, 2003). Ecosystem distributions were modeled using a biophysical stratification approach developed for South America (Sayre and others, 2008) and now being implemented globally (Sayre and others, 2007). Bioclimate regimes strongly influence the differentiation and distribution of terrestrial ecosystems, and are one of the key input layers in the ecosystem delineation process.The Rivas-Martínez methodology used to produce...
Contemporary climate change in Alaska has resulted in amplified rates of press and pulse disturbances that drive ecosystem change with significant consequences for socio-environmental systems. Despite the vulnerability of Arctic and boreal landscapes to change, little has been done to characterize landscape change and associated drivers across northern high-latitude ecosystems. Here we characterize the historical sensitivity of Alaska’s ecosystems to environmental change and anthropogenic disturbances using expert knowledge, remote sensing data, and spatiotemporal analyses and modeling. Time-series analysis of moderate– and high-resolution imagery was used to characterize land and water-surface dynamics across Alaska....
A lower limit for nitrogen loss from desert ecosystems in the southwestern United States was estimated by comparing nitrogen inputs to the amount of nitrogen stored in desert soils and vegetation. Atmospheric input of nitrogen for the last 10 000 years was conservatively estimated to be 2.99 kg N/m2. The amount of nitrogen stored in desert soils was calculated to be 0.604 kg N/m3 using extant data from 212 profiles located in Arizona, California, Nevada, and Utah. The average amount of nitrogen stored in desert vegetation is approximately 0.036 kg N/m2. Desert conditions have existed in the southwestern United States throughout the last 10 000 years. Under such conditions, vertical leaching of nitrogen below a depth...
Categories: Publication;
Types: Citation,
Journal Citation;
Tags: Biogeochemistry,
Springer Netherlands,
deserts,
ecosystem,
nitrogen,
Some theoretical results concerning the nature of the relationship between the scientific quality and economic value of imperfect weather forecasts are obtained. A prototype multistage decision-making model is considered, involving only two possible actions and two possible states of weather. This particular form of model is motivated by a real-world application known as the fruit-frost problem. For an infinite-horizon, discounted version of this model it is shown that economic value remains zero below a forecast quality threshold and then rises monotonically but nonlinearly above this threshold. In particular, the relative sensitivity of economic value to changes in the quality of forecasts increases as perfect...
Categories: Publication;
Types: Citation;
Tags: Quantifying,
changes,
development,
ecosystem,
energy,
This map shows the current distribution of aquatic ecosystems, in addition to the input datasets used when these distributions were modeled. These data are provided by Bureau of Land Management (BLM) "as is" and may contain errors or omissions. The User assumes the entire risk associated with its use of these data and bears all responsibility in determining whether these data are fit for the User's intended use. These data may not have the accuracy, resolution, completeness, timeliness, or other characteristics appropriate for applications that potential users of the data may contemplate. The User is encouraged to carefully consider the content of the metadata file associated with these data. The BLM should be cited...
This map shows the status of aquatic ecosystems, in addition to the input datasets used for the analysis and distribution modeling that were involved in producing these status datasets. These data are provided by Bureau of Land Management (BLM) "as is" and may contain errors or omissions. The User assumes the entire risk associated with its use of these data and bears all responsibility in determining whether these data are fit for the User's intended use. These data may not have the accuracy, resolution, completeness, timeliness, or other characteristics appropriate for applications that potential users of the data may contemplate. The User is encouraged to carefully consider the content of the metadata file associated...
This map shows the status of aquatic ecosystems, in addition to the input datasets used for the analysis and distribution modeling that were involved in producing these status datasets. These data are provided by Bureau of Land Management (BLM) "as is" and may contain errors or omissions. The User assumes the entire risk associated with its use of these data and bears all responsibility in determining whether these data are fit for the User's intended use. These data may not have the accuracy, resolution, completeness, timeliness, or other characteristics appropriate for applications that potential users of the data may contemplate. The User is encouraged to carefully consider the content of the metadata file associated...
Subset of "Risk Model of Invasive Annual Grasses" - 15% category This dataset represents the location and class density of potential annual grass risk within the Central Great Basin and Mojave Basin Ecoregion for the 2010 time period. This model represent a composite of multiple inductive (Maximum Entropy) models of varying annual grass cover using non-spectral landscape variables. Input Variables: elevation, aspect, distance to fire, geology, distance to hydric soils, distance to intermitant streams, landform, ombrotype, distance to perrenial streams, soil pH, density of primary roads, density of secondary/local roads, percent sandy soil, slope, thermotype. Classification of Model 0-No/Low Risk 1- < 5% Cover Risk...
This map shows the current and near-term status of terrestrial ecosystems, in addition to the input datasets used for the analysis and distribution modeling that were involved in producing these status datasets. These data are provided by Bureau of Land Management (BLM) "as is" and may contain errors or omissions. The User assumes the entire risk associated with its use of these data and bears all responsibility in determining whether these data are fit for the User's intended use. These data may not have the accuracy, resolution, completeness, timeliness, or other characteristics appropriate for applications that potential users of the data may contemplate. The User is encouraged to carefully consider the content...
BLM REA COP 2010 NatureServe National Landcover (v27) ColoradoPlateauPJWoodland_NatureServe_DIST_30m
The dataset represents the work of multiple states and Federal agencies as part of the US Gap Analysis and LandFire programs. Multi-season satellite imagery (Landsat ETM+) from 1999-2001 were used in conjunction with digital elevation model (DEM) derived datasets (e.g. elevation, landform) to model natural and semi-natural vegetation. The minimum mapping unit for this dataset is approximately 1 acre. Landcover classes are drawn from NatureServe's Ecological System concept. Five-hundred and fourty-four land cover classes composed of 12 cultural and 532 Natural/Semi-natural types are described. Land cover classes were mapped with a variety of techniques including decision tree classifiers, terrian modeling, inductive...
The dataset represents the work of multiple states and Federal agencies as part of the US Gap Analysis and LandFire programs. Multi-season satellite imagery (Landsat ETM+) from 1999-2001 were used in conjunction with digital elevation model (DEM) derived datasets (e.g. elevation, landform) to model natural and semi-natural vegetation. The minimum mapping unit for this dataset is approximately 1 acre. Landcover classes are drawn from NatureServe's Ecological System concept. Five-hundred and fourty-four land cover classes composed of 12 cultural and 532 Natural/Semi-natural types are described. Land cover classes were mapped with a variety of techniques including decision tree classifiers, terrian modeling, inductive...
This map shows the current and near-term status of terrestrial ecosystems, in addition to the input datasets used for the analysis and distribution modeling that were involved in producing these status datasets. These data are provided by Bureau of Land Management (BLM) "as is" and may contain errors or omissions. The User assumes the entire risk associated with its use of these data and bears all responsibility in determining whether these data are fit for the User's intended use. These data may not have the accuracy, resolution, completeness, timeliness, or other characteristics appropriate for applications that potential users of the data may contemplate. The User is encouraged to carefully consider the content...
This map shows the current and near-term status of aquatic ecosystems, in addition to the input datasets used for the analysis and distribution modeling that were involved in producing these status datasets. These data are provided by Bureau of Land Management (BLM) "as is" and may contain errors or omissions. The User assumes the entire risk associated with its use of these data and bears all responsibility in determining whether these data are fit for the User's intended use. These data may not have the accuracy, resolution, completeness, timeliness, or other characteristics appropriate for applications that potential users of the data may contemplate. The User is encouraged to carefully consider the content of...
|

|
