Filters: Tags: forest (X)
1,020 results (166ms)|
Filters
Date Range
Extensions Types Contacts
Categories Tag Types
|
This data set contains the results from a weighted sum of input layers with the mean value calculated for each 6th level HUC in the Northwest PlainsEcoregion.
Aerial Insect and Disease Detection Survey(ADS) for insect and disease activity in 1995. The ADS data was obtained to be used for BLMs REA Process for the Northwestern Plains ecoregion. The original data was combined from USFS regions within the ecoregion then clipped to the Northwestern Plains Level III ecoregion plus a buffer that consists of the 5th level Hydrologic Unit Code (HUC) watersheds that intersect the ecoregion.
Aerial insect and disease survey for 2009, USDA Forest Service, Region 1. Should be used in conjunction with the fly/no fly layer fnf09 to determine which areas were or were not surveyed for 2009.
Aerial Insect and Disease Detection Survey(ADS) for Mountain Pine Beetle activity in 1994 - 2010. The ADS data was obtained to be used for BLMs REA Process for the Northwestern Great Plains ecoregion. The original data was combined from USFS regions within the ecoregion then clipped to the Northwestern Great Plains Level III ecoregion plus a buffer that consists of the 5th level Hydrologic Unit Code (HUC) watersheds that intersect the ecoregion.
A 10 km moving window was used on the Other Conifer conservation element to determine the relative density of Other Conifer within the moving window.
The 2030 Ponderosa pine viablitly was average based on the 7 climate models and clipped to the ecoregion.
The FSim burn probability was used to determine the burn probability of the other conifer vegetation communities. This layer was used in the intactness management question and the results weren't rolled up to an analysis unit.
The FSim burn probability was used to determine the burn probability of the juniper vegetation communities. This layer was used in the intactness management question and the results weren't rolled up to an analysis unit.
The FSim burn probability was used to determine the majority (most common) burn probability within a 4km analysis unit in areas with other conifer vegetation communities withing the ecoregion.
The FSim burn probability was used to determine the majority (most common) burn probability within a 4km analysis unit in areas with aspen vegetation communities withing the ecoregion.
The 2030 Western juniper viablitly was average based on the 7 climate models and clipped to the ecoregion.
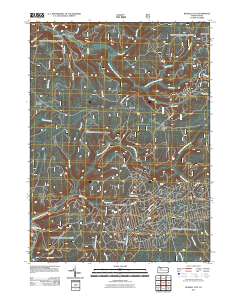
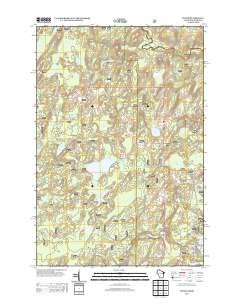
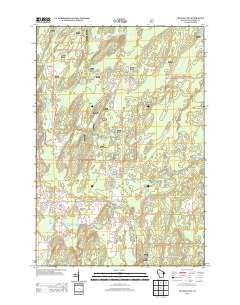
Layered GeoPDF 7.5 Minute Quadrangle Map. Layers of geospatial data include orthoimagery, roads, grids, geographic names, elevation contours, hydrography, and other selected map features.
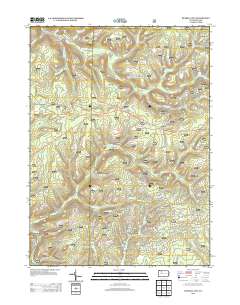
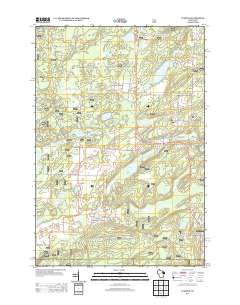
Layered GeoPDF 7.5 Minute Quadrangle Map. Layers of geospatial data include orthoimagery, roads, grids, geographic names, elevation contours, hydrography, and other selected map features.
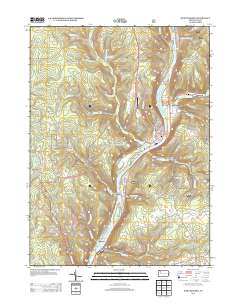
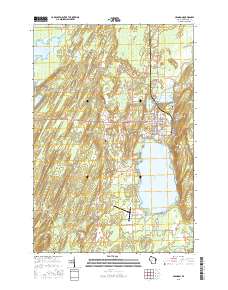
Layered GeoPDF 7.5 Minute Quadrangle Map. Layers of geospatial data include orthoimagery, roads, grids, geographic names, elevation contours, hydrography, and other selected map features.
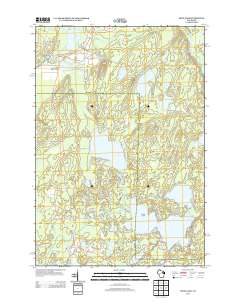
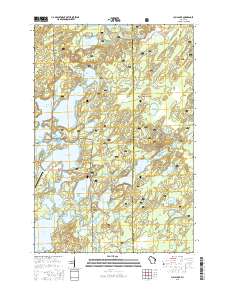
Layered GeoPDF 7.5 Minute Quadrangle Map. Layers of geospatial data include orthoimagery, roads, grids, geographic names, elevation contours, hydrography, and other selected map features.
Layered GeoPDF 7.5 Minute Quadrangle Map. Layers of geospatial data include orthoimagery, roads, grids, geographic names, elevation contours, hydrography, and other selected map features.
Layered GeoPDF 7.5 Minute Quadrangle Map. Layers of geospatial data include orthoimagery, roads, grids, geographic names, elevation contours, hydrography, and other selected map features.
Layered GeoPDF 7.5 Minute Quadrangle Map. Layers of geospatial data include orthoimagery, roads, grids, geographic names, elevation contours, hydrography, and other selected map features.
Layered GeoPDF 7.5 Minute Quadrangle Map. Layers of geospatial data include orthoimagery, roads, grids, geographic names, elevation contours, hydrography, and other selected map features.
Layered GeoPDF 7.5 Minute Quadrangle Map. Layers of geospatial data include orthoimagery, roads, grids, geographic names, elevation contours, hydrography, and other selected map features.
|

|
