Filters: Tags: phosphorus (X)
270 results (103ms)|
Filters
Date Range
Extensions Types
Contacts
Categories Tag Types
|
Nitrogen, phosphorus, and suspended-sediment loads, and changes in loads, in major rivers across the Chesapeake Bay watershed have been calculated using monitoring data from the Chesapeake Bay River Input Monitoring Network (RIM) stations for the period 1985 through 2017. Nutrient and suspended-sediment loads and changes in loads were determined by applying a weighted regression approach called WRTDS (Weighted Regression on Time, Discharge, and Season). Yields (represents the mass of constituent transported from a unit area of a given watershed) are used to compare the export loads from one basin to another. Yield results are obtained by dividing the annual load (pounds) of a given constituent by the respective...
Categories: Data;
Types: Map Service,
OGC WFS Layer,
OGC WMS Layer,
OGC WMS Service;
Tags: Chesapeake Bay Watershed,
Delaware,
Maryland,
New York,
Pennsylvania,
This R script can be used to analyze SELDM results. The script is specifically tailored for the SELDM simulations used in the publication: Stonewall, A.J., and Granato, G.E., 2019, Assessing potential effects of highway and urban runoff on receiving streams in total maximum daily load watersheds in Oregon using the Stochastic Empirical Loading and Dilution Model: U.S. Geological Survey Scientific Investigations Report 2019-5053, 116 p., https://doi.org/10.3133/sir20195053
Nitrogen, phosphorus, and suspended-sediment loads, and changes in loads, in major rivers across the Chesapeake Bay watershed have been calculated using monitoring data from the Chesapeake Bay River Input Monitoring Network (RIM) stations for the period 1985 through 2018. Nutrient and suspended-sediment loads and changes in loads were determined by applying a weighted regression approach called WRTDS (Weighted Regression on Time, Discharge, and Season). Yields (represents the mass of constituent transported from a unit area of a given watershed) are used to compare the export loads from one basin to another. Yield results are obtained by dividing the annual load (pounds) of a given constituent by the respective...
Categories: Data;
Types: Map Service,
OGC WFS Layer,
OGC WMS Layer,
OGC WMS Service;
Tags: Chesapeake Bay Watershed,
Delaware,
Maryland,
New York,
Pennsylvania,
The U.S. Geological Survey (USGS) has undertaken a mineral resources assessment for tungsten for a portion of the Great Basin in parts of western Nevada and east-central California. This data release provides the Great Basin Tungsten Database: the geospatial and geologic data, and results of chemical analyses for 46,955 samples collected in the assessment area, extracted from the USGS National Geochemical Database. These rock records were collected as part of various programs and projects at the USGS and analyzed from 1963 to 2015. The database represents rock records, each comprising one best value chemical determination for each analyzed chemical species, that include skarns, carbonate lithologies (for example,...
Categories: Data;
Types: Downloadable,
Map Service,
OGC WFS Layer,
OGC WMS Layer,
Shapefile;
Tags: California,
GGGSC,
Geology, Geophysics, and Geochemistry Science Center,
Great Basin,
MRP,
Nitrogen, phosphorus, and suspended-sediment loads, and changes in loads, in major rivers across the Chesapeake Bay watershed have been calculated using monitoring data from the Chesapeake Bay River Input Monitoring Network (RIM) stations for the period 1985 through 2019. Nutrient and suspended-sediment loads and changes in loads were determined by applying a weighted regression approach called WRTDS (Weighted Regression on Time, Discharge, and Season). The load results represent the total mass of nitrogen, phosphorus, and suspended sediment that was exported from each of the RIM watersheds.
Categories: Data;
Types: Map Service,
OGC WFS Layer,
OGC WMS Layer,
OGC WMS Service;
Tags: Chesapeake Bay Watershed,
Delaware,
Maryland,
New York,
Pennsylvania,
Nitrogen, phosphorus, and suspended-sediment loads, and changes in loads, in major rivers across the Chesapeake Bay watershed have been calculated using monitoring data from the Chesapeake Bay River Input Monitoring (RIM) Network stations for the period 1985 through 2023. Nutrient and suspended-sediment loads and changes in loads were determined by applying a weighted regression approach called WRTDS (Weighted Regression on Time, Discharge, and Season). The load results represent the total mass of nitrogen, phosphorus, and suspended sediment that was exported from each of the RIM watersheds.
Categories: Data;
Types: Map Service,
OGC WFS Layer,
OGC WMS Layer,
OGC WMS Service;
Tags: Chesapeake Bay Watershed,
Delaware,
Kalman filtering,
Maryland,
New York,
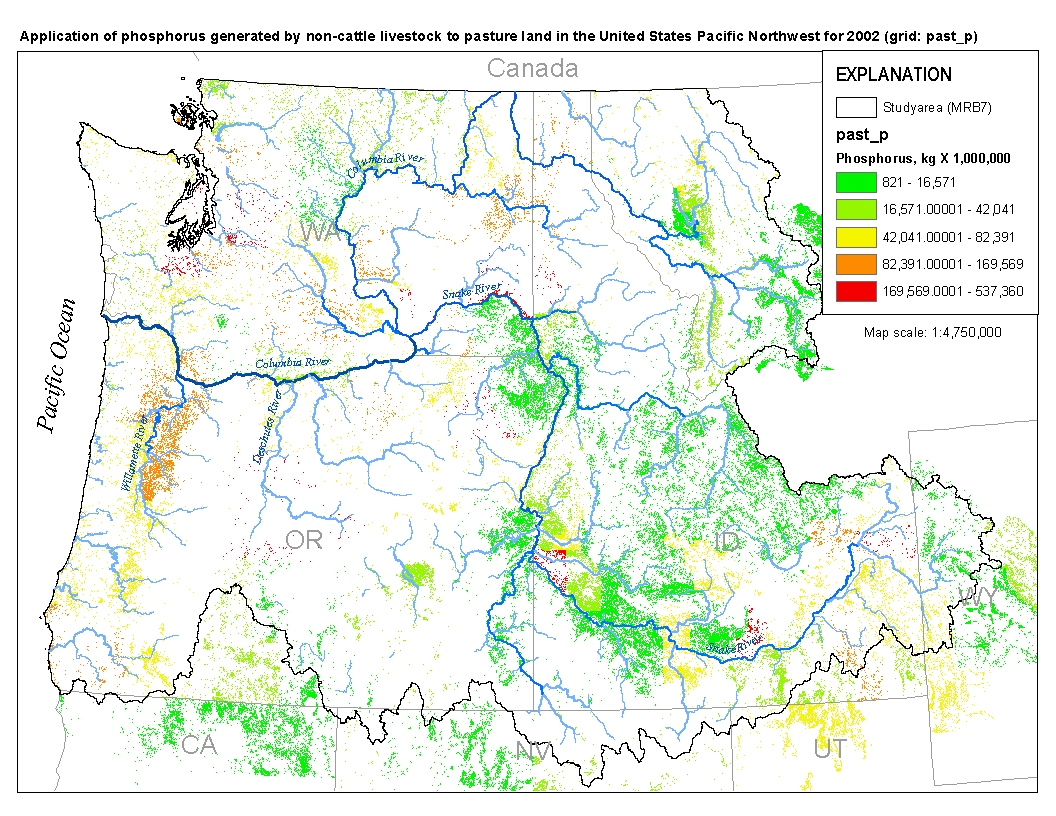
This spatial data set was created by the U.S. Geological Survey (USGS) to represent the amount of phosphorus generated by pastured, non-cattle livestock that was applied to pasture land in the Pacific Northwest region of the United States (Hydro Region 17; Major River Basin 7 (MRB7)) during 2002.
Nitrogen, phosphorus, and suspended-sediment loads, and changes in loads, in major rivers across the Chesapeake Bay watershed have been calculated using monitoring data from the Chesapeake Bay River Input Monitoring (RIM) Network stations for the period 1985 through 2021. Nutrient and suspended-sediment loads and changes in loads were determined by applying a weighted regression approach called WRTDS (Weighted Regression on Time, Discharge, and Season). Yields (representing the mass of constituent transported from a unit area of a given watershed) are used to compare the export loads from one basin to another. Yield results are obtained by dividing the annual load (pounds) of a given constituent by the respective...
Categories: Data;
Types: Map Service,
OGC WFS Layer,
OGC WMS Layer,
OGC WMS Service;
Tags: Chesapeake Bay Watershed,
Delaware,
Kalman filtering,
Maryland,
New York,
Nitrogen, phosphorus, and suspended-sediment loads, and changes in loads, in major rivers across the Chesapeake Bay watershed have been calculated using monitoring data from the Chesapeake Bay River Input Monitoring Network (RIM) stations for the period 1985 through 2019. Nutrient and suspended-sediment loads and changes in loads were determined by applying a weighted regression approach called WRTDS (Weighted Regression on Time, Discharge, and Season). The load results represent the total mass of nitrogen, phosphorus, and suspended sediment that was exported from each of the RIM watersheds.
Categories: Data;
Types: Map Service,
OGC WFS Layer,
OGC WMS Layer,
OGC WMS Service;
Tags: Chesapeake Bay Watershed,
Delaware,
Maryland,
New York,
Pennsylvania,

These data were released prior to the October 1, 2016 effective date for the USGS’s policy dictating the review, approval, and release of scientific data as referenced in USGS Survey Manual Chapter 502.8 Fundamental Science Practices: Review and Approval of Scientific Data for Release. Under section 303(d) of the 1972 Clean Water Act, states, territories, and authorized tribes are required to develop lists of impaired waters. These impaired waters do not meet water quality standards that states, territories, and authorized tribes have set for them, even after point sources of pollution have installed the minimum required levels of pollution control technology. The law requires that these jurisdictions establish...
Great Lakes coastal marshes have the potential to filter water coming off of the landscape and remove sediments and nutrients before they reach the lakes. However, this ability has largely been neutralized as vast areas of coastal wetlands have been isolated behind dikes; while at the same time the Great Lakes continue to suffer from excess phosphorus loading. In this study we used high-frequency measurements of discharge and turbidity to estimate sediment and phosphorus retention in a formerly diked coastal wetland. We found sediment and phosphorus retention to be episodic and highly related to fluctuations in water level. Low water levels in Lake Erie in late 2012 resulted in low retention in the wetland, but...
Categories: Data;
Types: Map Service,
OGC WFS Layer,
OGC WMS Layer,
OGC WMS Service;
Tags: Hydrology,
Hydrology,
Lake Erie,
Ottawa National Wildlife Refuge, Lucas County, Ohio,
Phosphorus,
In regions subject to strong winds, considerable amounts of soil are transported off land and deposited to nearby fields and surface water. This study investigated the nutrient supply from deposition of erodible-sized soil to surrounding soil and surface water in a controlled laboratory setting. Wind-erodible fraction (WEF) aggregates were collected from a field with no manure or fertilizer application (Treatment WEF0) and a field that had received 180 Mg ha-1 year-1 of cattle manure (WEF180) for 30 years. The WEF aggregates were applied to a loamy sand soil and to distilled water at rates equivalent to 0, 10, 50, 100, and 150 Mg ha-1 and incubated for 2 years. Deposition of carbon and nutrient-enriched WEF aggregates...
Categories: Publication;
Types: Citation,
Journal Citation;
Tags: Nitrogen,
Soil Science,
phosphorus,
soil available N,
soil carbon,
In this data release, we provide the data used to compute total annual phosphorus loads from tributaries and direct drainages to the Great Lakes during 2012-18 using the model load ratio approach and the unit area load approach and the resulting annual loads for 2012–18. This data release consists of: (1) measured loads at 24 sites, computed using the surrogate regression approach (Robertson et al., 2018; Koltun, 2020) that were monitored as part of the Great Lakes Restoration Initiative project, (2) estimated annual loads at point source facilities throughout the Great Lakes Basin obtained from the U.S. Environmental Protection Agency and state agencies, (3) loads subdivided into nonpoint and point source contributions,...
Types: Map Service,
OGC WFS Layer,
OGC WMS Layer,
OGC WMS Service;
Tags: Extrapolation,
Freshwater ecosystems,
Great Lakes,
Great Lakes Basin,
Loads,
Nitrogen, phosphorus, and suspended-sediment loads, and changes in loads, in major rivers across the Chesapeake Bay watershed have been calculated using monitoring data from the Chesapeake Bay River Input Monitoring (RIM) stations for the period 1985 through 2018. Nutrient and suspended-sediment loads and changes in loads were determined by applying a weighted regression approach called WRTDS (Weighted Regression on Time, Discharge, and Season). The load results represent the total mass of nitrogen, phosphorus, and suspended sediment that was exported from each of the RIM watersheds. To determine the trend in loads, the annual load results are flow normalized to integrate out the year-to-year variability in river...
Types: Map Service,
OGC WFS Layer,
OGC WMS Layer,
OGC WMS Service;
Tags: Chesapeake Bay Watershed,
Delaware,
Environmental Health,
Maryland,
New York,
This data release contains estimates of annual nitrate, suspended sediment, phosphorus, and chloride loads and uncertainty from sites in the Illinois Environmental Protection Agency (Illinois EPA) Ambient Water Quality Monitoring Network. The loads were estimated using Weighted Regressions on Time, Discharge, and Season with Kalman filtering (WRTDS-K) and existing discrete water-quality data and discharge data collected by Illinois EPA, the U.S. Geological Survey, and Illinois State Water Survey through water year (WY) 2020. All water-quality and discharge data used in this work are available from the Water Quality Portal and the National Water Information System. The data release comprises a single comma-separated...
Categories: Data;
Tags: Ambient Water-Quality Monitoring Network,
Hydrology,
Illinois,
USGS Science Data Catalog (SDC),
Water Quality,
This USGS Data Release represents tabular data for chemical and physical attributes, rates of deposition, erosion, and mineralization of bank and floodplain sediments and soils from five study sites in the Smith Creek watershed between 2012 and 2015. The data release was produced in compliance with the new 'open data' requirements as a way to make the scientific products associated with USGS research efforts and publications available to the public. The dataset consists of 2 separate items: 1. Smith Creek floodplain soils dataset (tabular data) 2. Smith Creek bank soils dataset (tabular data) These data support the following publication: Gillespie, J.L., Noe, G.B., Hupp, C.R., Gellis, A.C., and Schenk, E.R.,...
Categories: Data;
Types: Citation,
Map Service,
OGC WFS Layer,
OGC WMS Layer,
OGC WMS Service;
Tags: Chesapeake Bay,
Massanutten Mountain Ridge,
Rockingham County, VA,
Shenandoah County, VA,
Shenandoah Valley,
Nitrogen, phosphorus, and suspended-sediment loads, and changes in loads, in major rivers across the Chesapeake Bay watershed have been calculated using monitoring data from the Chesapeake Bay River Input Monitoring Network (RIM) stations for the period 1985 through 2017. Nutrient and suspended-sediment loads and changes in loads were determined by applying a weighted regression approach called WRTDS (Weighted Regression on Time, Discharge, and Season). The load results represent the total mass of nitrogen, phosphorus, and suspended sediment that was exported from each of the RIM watersheds.
Categories: Data;
Types: Map Service,
OGC WFS Layer,
OGC WMS Layer,
OGC WMS Service;
Tags: Chesapeake Bay Watershed,
Delaware,
Maryland,
New York,
Pennsylvania,
Nitrogen, phosphorus, and suspended-sediment loads, and changes in loads, in rivers across the Chesapeake Bay watershed have been calculated using monitoring data from the Chesapeake Bay Nontidal Network (NTN) stations for the period 1985 through 2016. Nutrient and suspended-sediment loads and changes in loads were determined by applying a weighted regression approach called WRTDS (Weighted Regression on Time, Discharge, and Season). The load results represent the total mass of nitrogen, phosphorus, and suspended sediment that was exported from each of the NTN watersheds.
Categories: Data;
Types: Citation,
Map Service,
OGC WFS Layer,
OGC WMS Layer,
OGC WMS Service;
Tags: Chesapeake Bay Watershed,
Delaware,
Maryland,
New York,
Pennsylvania,
Nitrogen, phosphorus, and suspended-sediment loads, and changes in loads, in major rivers across the Chesapeake Bay watershed have been calculated using monitoring data from the Chesapeake Bay River Input Monitoring (RIM) Network stations for the period 1985 through 2020. Nutrient and suspended-sediment loads and changes in loads were determined by applying a weighted regression approach called WRTDS (Weighted Regression on Time, Discharge, and Season). The load results represent the total mass of nitrogen, phosphorus, and suspended sediment that was exported from each of the RIM watersheds.
Categories: Data;
Types: Map Service,
OGC WFS Layer,
OGC WMS Layer,
OGC WMS Service;
Tags: Chesapeake Bay Watershed,
Delaware,
Kalman filtering,
Maryland,
New York,
|

|
