Filters: Tags: slope (X)
190 results (16ms)|
Filters
Date Range
Extensions Types Contacts
Categories Tag Types
|
The purpose of this study is to evaluate tsunami hazard for the community of Seward and northern Resurrection Bay area, Alaska. This report will provide guidance to local emergency managers in tsunami hazard assessment. We used a numerical modeling method to estimate the extent of inundation by tsunami waves generated from earthquake and landslide sources. Our tsunami scenarios included a repeat of the tsunami of the 1964 Great Alaska Earthquake, as well as tsunami waves generated by two hypothetical Yakataga Gap earthquakes in northeastern Gulf of Alaska, hypothetical earthquakes in Prince William Sound and Kodiak asperities of the 1964 rupture, and local underwater landslides in Resurrection Bay. Results of numerical...
Potential tsunami hazards for the Fox Islands communities of Unalaska/Dutch Harbor and Akutan were evaluated by numerically modeling the extent of inundation from tsunami waves generated by hypothetical earthquake sources and taking into account historical observations. Worst-case hypothetical scenarios are defined by analyzing results of a sensitivity study of the tsunami dynamics related to various slip distributions along the Aleutian megathrust. The worst-case scenarios for Unalaska and Akutan are thought to be thrust earthquakes in the Fox Islands region with magnitudes ranging from Mw 8.8 to Mw 9.1 that have their greatest slip at 30-40 km (18-25 mi) depth. We also consider Tohoku-type ruptures and an outer-rise...
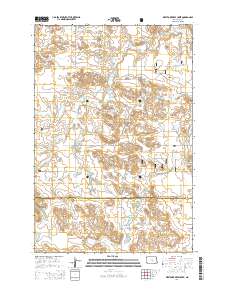
Layered GeoPDF 7.5 Minute Quadrangle Map. Layers of geospatial data include orthoimagery, roads, grids, geographic names, elevation contours, hydrography, and other selected map features.

Layered GeoPDF 7.5 Minute Quadrangle Map. Layers of geospatial data include orthoimagery, roads, grids, geographic names, elevation contours, hydrography, and other selected map features.
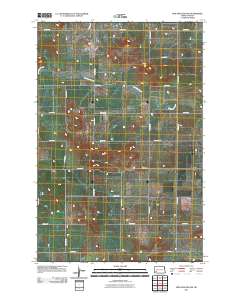
Layered GeoPDF 7.5 Minute Quadrangle Map. Layers of geospatial data include orthoimagery, roads, grids, geographic names, elevation contours, hydrography, and other selected map features.
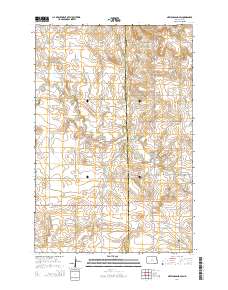
Layered GeoPDF 7.5 Minute Quadrangle Map. Layers of geospatial data include orthoimagery, roads, grids, geographic names, elevation contours, hydrography, and other selected map features.
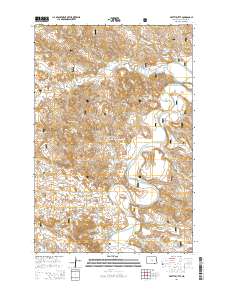
Layered GeoPDF 7.5 Minute Quadrangle Map. Layers of geospatial data include orthoimagery, roads, grids, geographic names, elevation contours, hydrography, and other selected map features.
The Watershed Boundary Dataset (WBD) is a comprehensive aggregated collection of hydrologic unit data consistent with the national criteria for delineation and resolution. It defines the areal extent of surface water drainage to a point except in coastal or lake front areas where there could be multiple outlets as stated by the "Federal Standards and Procedures for the National Watershed Boundary Dataset (WBD)" "Standard" (https://pubs.usgs.gov/tm/11/a3/). Watershed boundaries are determined solely upon science-based hydrologic principles, not favoring any administrative boundaries or special projects, nor particular program or agency. This dataset represents the hydrologic unit boundaries to the 12-digit (6th level)...
These data were released prior to the October 1, 2016 effective date for the USGS’s policy dictating the review, approval, and release of scientific data as referenced in USGS Survey Manual Chapter 502.8 Fundamental Science Practices: Review and Approval of Scientific Data for Release. These datasets consist of a workspace (folder) containing a collection of gridded datasets plus a personal geodatabase containing several vector datasets. These datasets are designed to be used with the ArcHydro Tools, developed by ESRI in partnership with the U.S. Geological Survey, StreamStats Development Team. The datasets, together with the ArcHydro Tools, allow users to delineate watersheds and compute several watershed characteristics....
The Geographic Names Information System (GNIS) is the Federal standard for geographic nomenclature. The U.S. Geological Survey developed the GNIS for the U.S. Board on Geographic Names, a Federal inter-agency body chartered by public law to maintain uniform feature name usage throughout the Government and to promulgate standard names to the public. The GNIS is the official repository of domestic geographic names data; the official vehicle for geographic names use by all departments of the Federal Government; and the source for applying geographic names to Federal electronic and printed products of all types.

These data were released prior to the October 1, 2016 effective date for the USGS’s policy dictating the review, approval, and release of scientific data as referenced in USGS Survey Manual Chapter 502.8 Fundamental Science Practices: Review and Approval of Scientific Data for Release. This data set represents soil surface slope, in percent times 1000, in the conterminous United States. The data set was used as an input data layer for a national model to predict nitrate concentration in shallow ground water. Nolan and Hitt (2006) developed two national models to predict contamination of ground water by nonpoint sources of nitrate. The nonlinear approach to national-scale Ground-WAter Vulnerability Assessment (GWAVA)...
The goal of this project is to provide a preliminary overview, at a National scale, the relative susceptibility of the Nation's coast to sea- level rise through the use of a coastal vulnerability index (CVI). This initial classification is based upon the variables geomorphology, regional coastal slope, tide range, wave height, relative sea-level rise and shoreline erosion and accretion rates. The combination of these variables and the association of these variables to each other furnish a broad overview of regions where physical changes are likely to occur due to sea-level rise.
Categories: Data;
Types: ArcGIS REST Map Service,
ArcGIS Service Definition,
Downloadable,
Map Service;
Tags: Alabama,
Beach,
Beach Erosion,
Coastal Geomorphology,
Coastal Hazards,

The Geographic Names Information System (GNIS) is the Federal standard for geographic nomenclature. The U.S. Geological Survey developed the GNIS for the U.S. Board on Geographic Names, a Federal inter-agency body chartered by public law to maintain uniform feature name usage throughout the Government and to promulgate standard names to the public. The GNIS is the official repository of domestic geographic names data; the official vehicle for geographic names use by all departments of the Federal Government; and the source for applying geographic names to Federal electronic and printed products of all types.
These data represent a land facet classification created for the Pacific Northwest Duke Landscape Resilience project.
Categories: Data;
Types: Map Service,
OGC WFS Layer,
OGC WMS Layer,
OGC WMS Service;
Tags: ALI,
Arid Lands Initiative,
California,
Data,
EARTH SCIENCE > LAND SURFACE > LANDSCAPE,
Layered GeoPDF 7.5 Minute Quadrangle Map. Layers of geospatial data include orthoimagery, roads, grids, geographic names, elevation contours, hydrography, and other selected map features.
Layered GeoPDF 7.5 Minute Quadrangle Map. Layers of geospatial data include orthoimagery, roads, grids, geographic names, elevation contours, hydrography, and other selected map features.
Layered GeoPDF 7.5 Minute Quadrangle Map. Layers of geospatial data include orthoimagery, roads, grids, geographic names, elevation contours, hydrography, and other selected map features.
Layered GeoPDF 7.5 Minute Quadrangle Map. Layers of geospatial data include orthoimagery, roads, grids, geographic names, elevation contours, hydrography, and other selected map features.
Layered GeoPDF 7.5 Minute Quadrangle Map. Layers of geospatial data include orthoimagery, roads, grids, geographic names, elevation contours, hydrography, and other selected map features.
Layered GeoPDF 7.5 Minute Quadrangle Map. Layers of geospatial data include orthoimagery, roads, grids, geographic names, elevation contours, hydrography, and other selected map features.
|

|
