Filters: Tags: water (X) > partyWithName: U.S. Geological Survey (X)
216 results (137ms)|
Filters
Contacts
(Less)
|
Geospatial data that is a derivative land cover product depicting woodland on topographic maps.
Geospatial data that is a derivative land cover product depicting woodland on topographic maps.
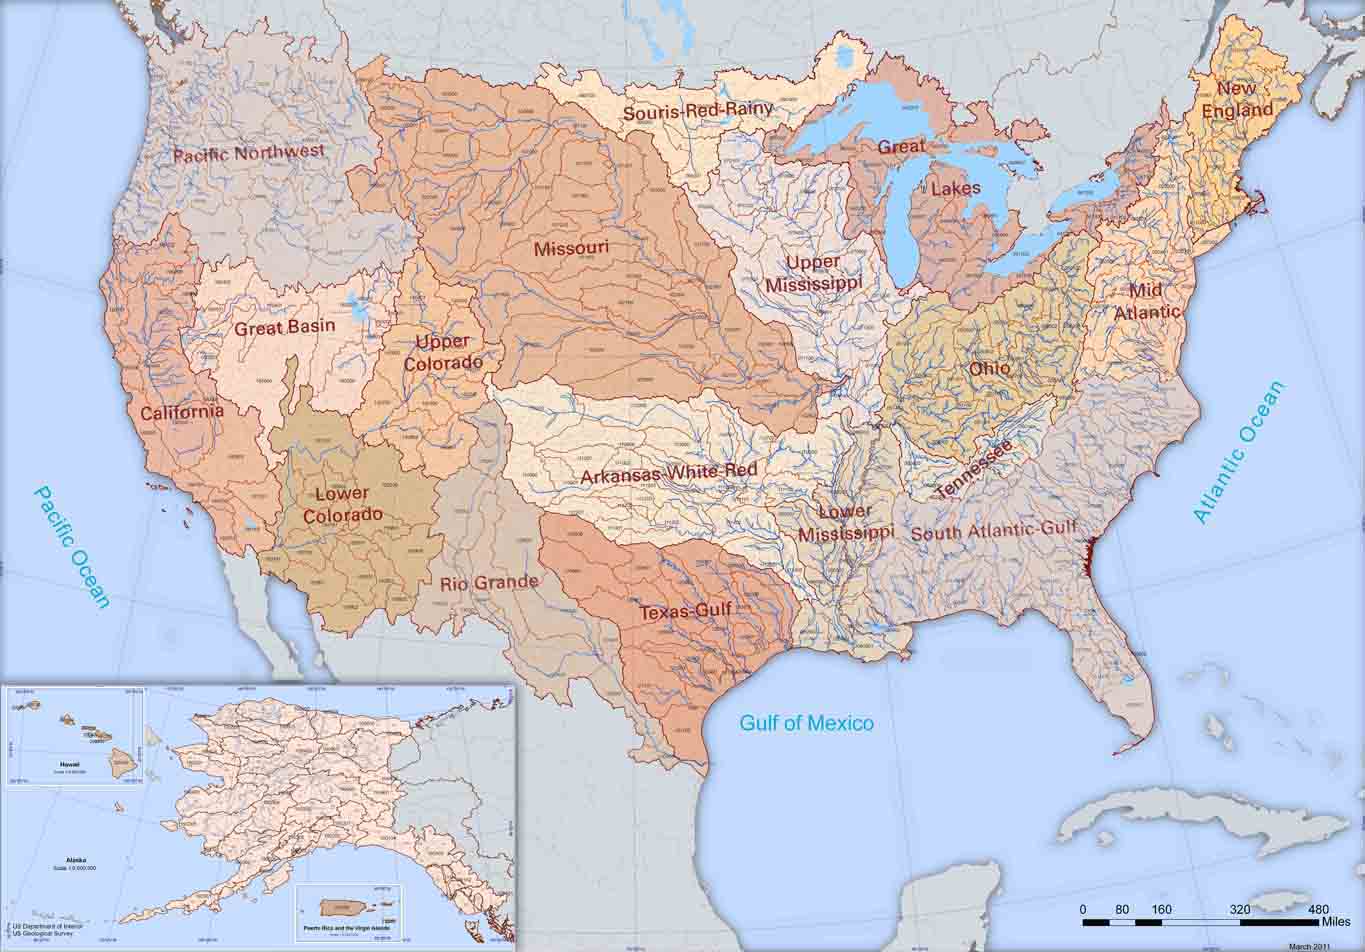
The Watershed Boundary Dataset (WBD) from The National Map (TNM) defines the perimeter of drainage areas formed by the terrain and other landscape characteristics. The drainage areas are nested within each other so that a large drainage area, such as the Upper Mississippi River, will be composed of multiple smaller drainage areas, such as the Wisconsin River. Each of these smaller areas can further be subdivided into smaller and smaller drainage areas. The WBD uses six different levels in this hierarchy, with the smallest averaging about 30,000 acres. The WBD is made up of polygons nested into six levels of data respectively defined by Regions, Subregions, Basins, Subbasins, Watersheds, and Subwatersheds. For additional...
Geospatial data that is a derivative land cover product depicting woodland on topographic maps.

USGS developed The National Map (TNM) Gazetteer as the Federal and national standard (ANSI INCITS 446-2008) for geographic nomenclature based on the Geographic Names Information System (GNIS). The National Map Gazetteer contains information about physical and cultural geographic features, geographic areas, and locational entities that are generally recognizable and locatable by name (have achieved some landmark status) and are of interest to any level of government or to the public for any purpose that would lead to the representation of the feature in printed or electronic maps and/or geographic information systems. The dataset includes features of all types in the United States, its associated areas, and Antarctica,...
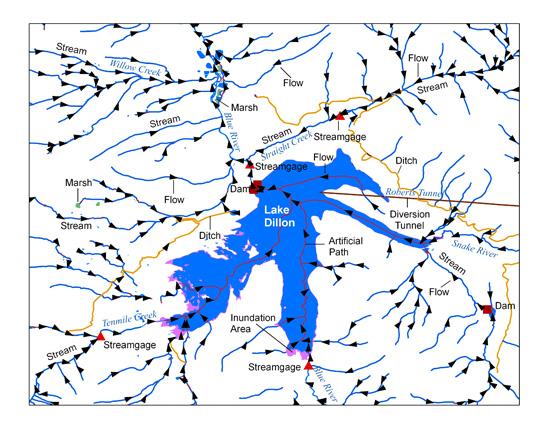
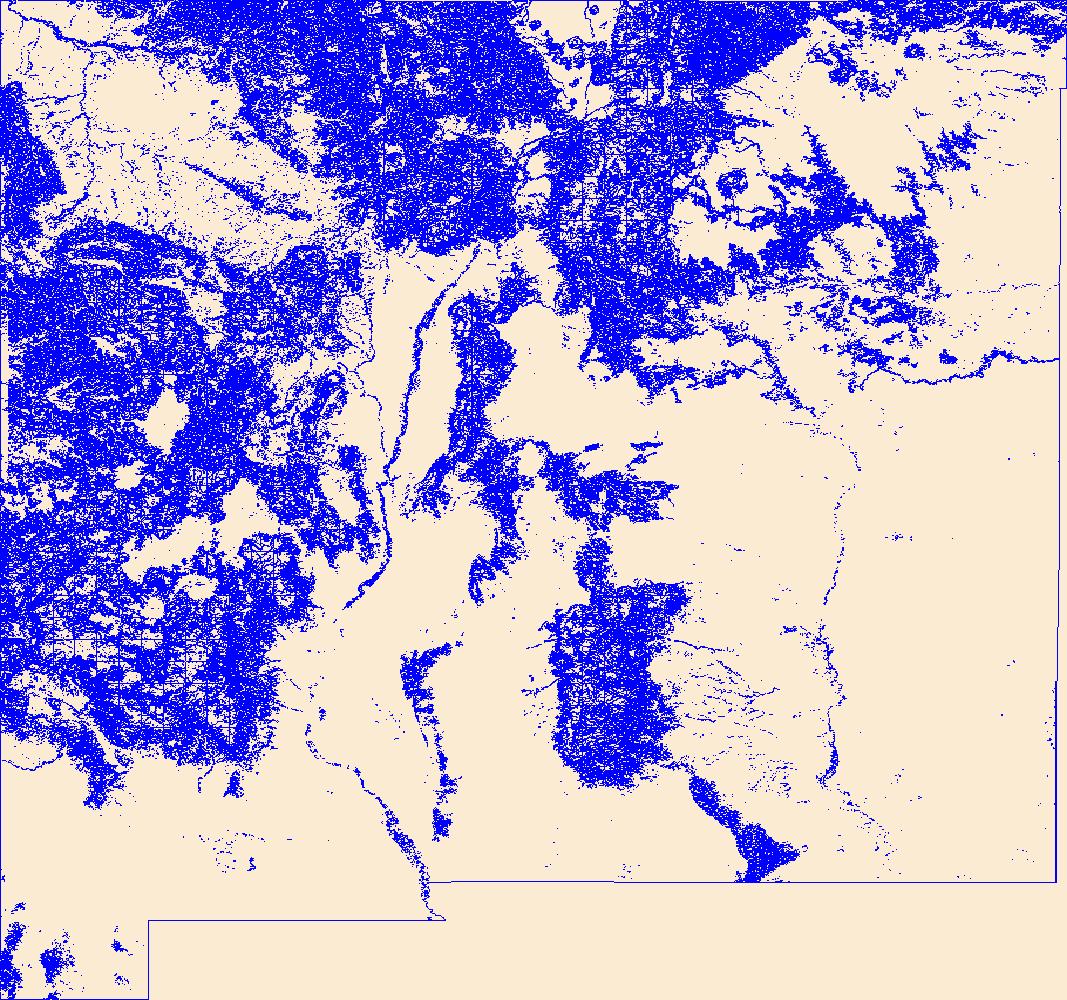
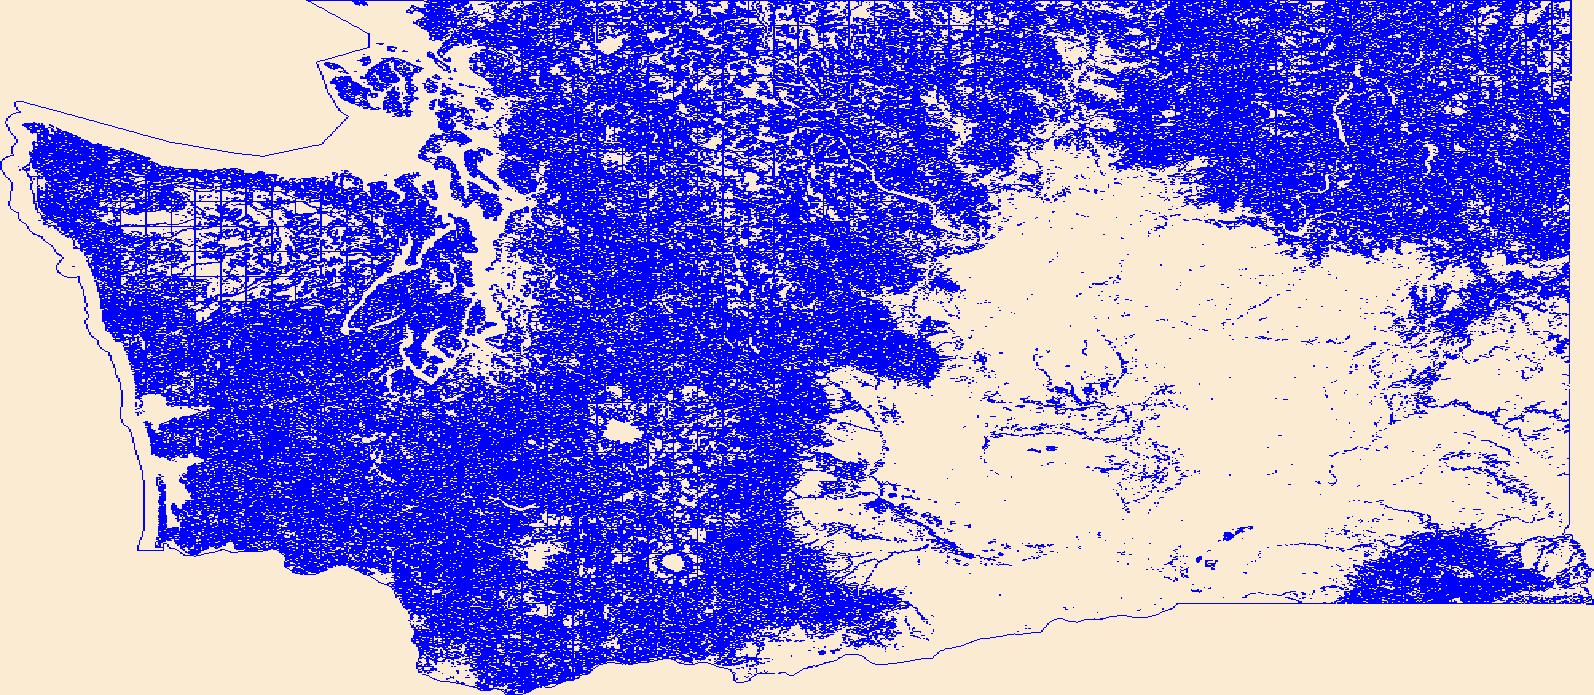
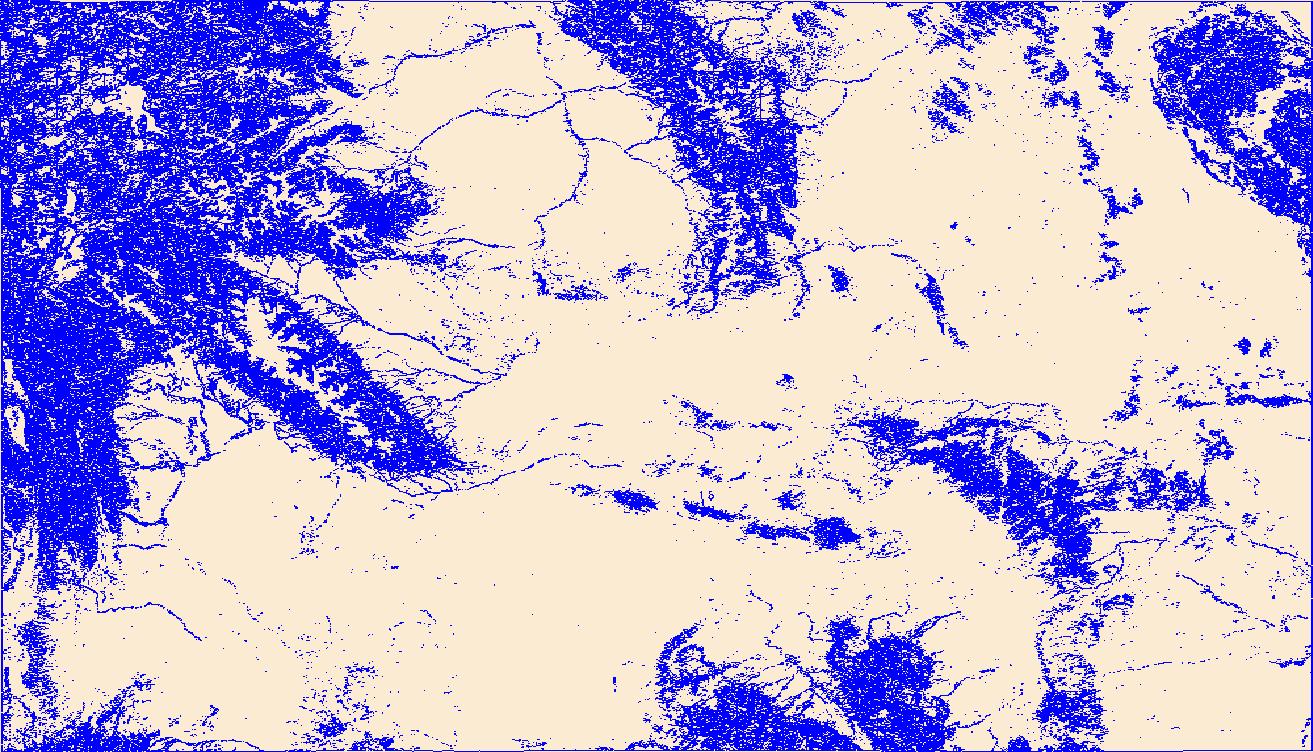
The USGS National Hydrography Dataset (NHD) service from The National Map (TNM) is a comprehensive set of digital spatial data that encodes information about naturally occurring and constructed bodies of surface water (lakes, ponds, and reservoirs), paths through which water flows (canals, ditches, streams, and rivers), and related entities such as point features (springs, wells, stream gages, and dams). The information encoded about these features includes classification and other characteristics, delineation, geographic name, position and related measures, a "reach code" through which other information can be related to the NHD, and the direction of water flow. The network of reach codes delineating water and...
Geospatial data that is a derivative land cover product depicting woodland on topographic maps.
Geospatial data that is a derivative land cover product depicting woodland on topographic maps.
Geospatial data that is a derivative land cover product depicting woodland on topographic maps.
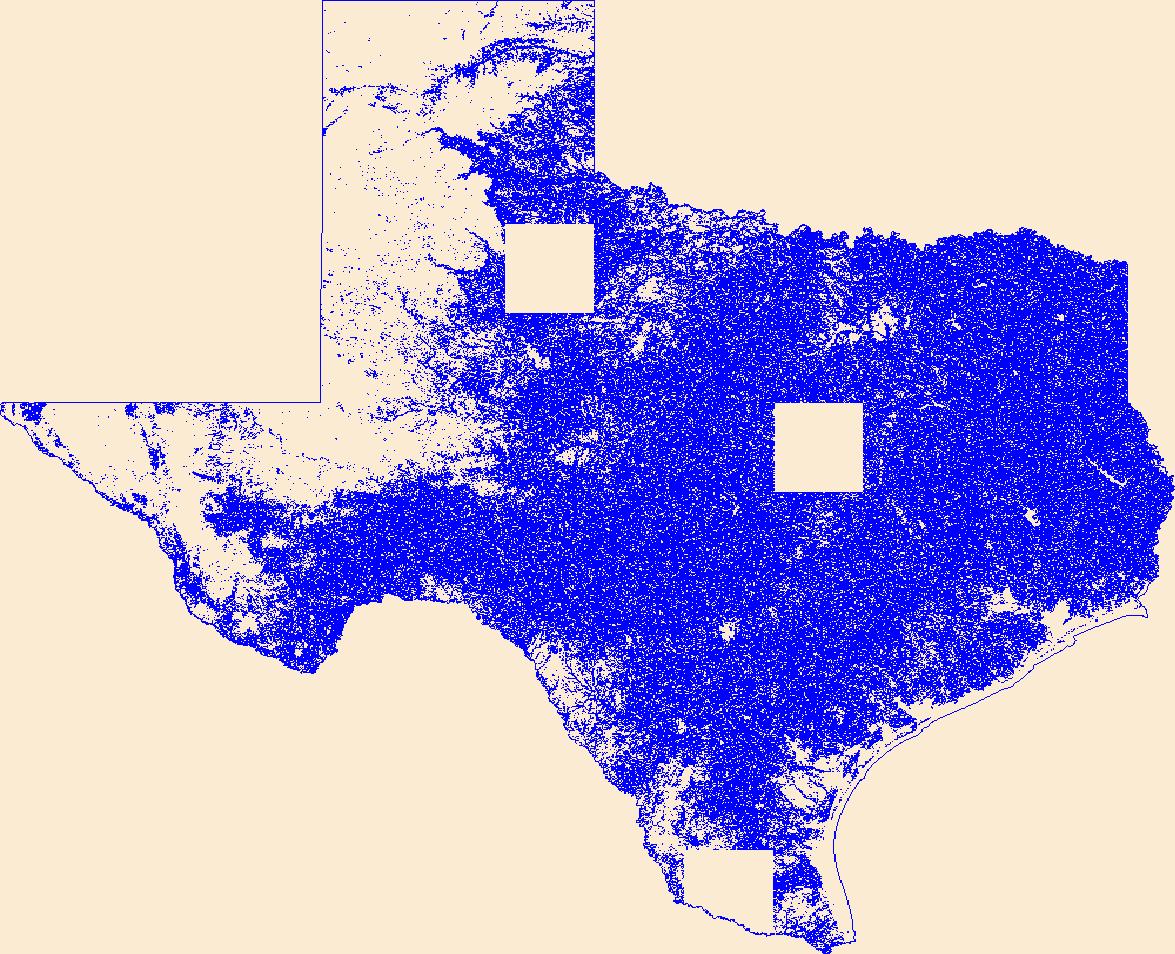
Geospatial data that is a derivative land cover product depicting woodland on topographic maps.
This dataset provides model specifications used to estimate water temperature from a process-based model (Hipsey et al. 2019). The format is a single JSON file indexed for each lake based on the "site_id". This dataset is part of a larger data release of lake temperature model inputs and outputs for 68 lakes in the U.S. states of Minnesota and Wisconsin (http://dx.doi.org/10.5066/P9AQPIVD).
This dataset includes model inputs that describe local weather conditions for Sparkling Lake, WI. Weather data comes from two sources: locally measured (2009-2017) and gridded estimates (all other time periods). There are two comma-delimited files, one for weather data (one row per model timestep) and one for ice-flags, which are used by the process-guided deep learning model to determine whether to apply the energy conservation constraint (the constraint is not applied when the lake is presumed to be ice-covered). The ice-cover flag is a modeled output and therefore not a true measurement (see "Predictions" and "pb0" model type for the source of this prediction). This dataset is part of a larger data release of...
Multiple modeling frameworks were used to predict daily temperatures at 0.5m depth intervals for a set of diverse lakes in the U.S. states of Minnesota and Wisconsin. Process-Based (PB) models were configured and calibrated with training data to reduce root-mean squared error. Uncalibrated models used default configurations (PB0; see Winslow et al. 2016 for details) and no parameters were adjusted according to model fit with observations. Deep Learning (DL) models were Long Short-Term Memory artificial recurrent neural network models which used training data to adjust model structure and weights for temperature predictions (Jia et al. 2019). Process-Guided Deep Learning (PGDL) models were DL models with an added...
This dataset includes model inputs that describe weather conditions for the 68 lakes included in this study. Weather data comes from gridded estimates (Mitchell et al. 2004). There are two comma-separated files, one for weather data (one row per model timestep) and one for ice-flags, which are used by the process-guided deep learning model to determine whether to apply the energy conservation constraint (the constraint is not applied when the lake is presumed to be ice-covered). The ice-cover flag is a modeled output and therefore not a true measurement (see "Predictions" and "pb0" model type for the source of this prediction). This dataset is part of a larger data release of lake temperature model inputs and outputs...
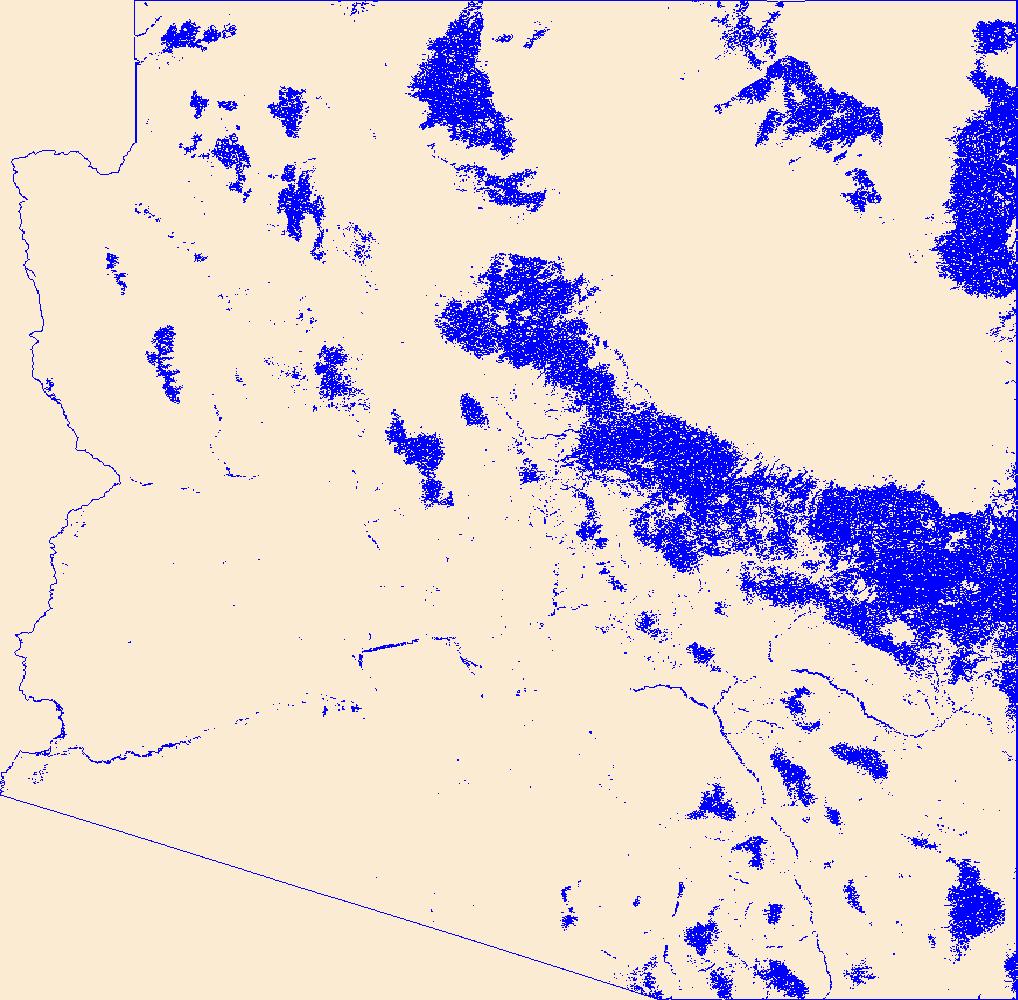
Geospatial data that is a derivative land cover product depicting woodland on topographic maps.
These data were released prior to the October 1, 2016 effective date for the USGS’s policy dictating the review, approval, and release of scientific data as referenced in USGS Survey Manual Chapter 502.8 Fundamental Science Practices: Review and Approval of Scientific Data for Release. This map shows specific water-quality items and hydrologic data site information which come from QWDATA (Water Quality) and GWSI (Ground Water Information System). Both QWDATA and GWSI are subsystems of NWIS (National Water Inventory System)of the USGS (United States Geologic Survey). This map is for Davis County, Utah. The scope and purpose of NWIS is defined on the web site: http://water.usgs.gov/public/pubs/FS/FS-027-98/
These data were released prior to the October 1, 2016 effective date for the USGS’s policy dictating the review, approval, and release of scientific data as referenced in USGS Survey Manual Chapter 502.8 Fundamental Science Practices: Review and Approval of Scientific Data for Release. This map shows specific water-quality items and hydrologic data site information which come from QWDATA (Water Quality) and GWSI (Ground Water Information System). Both QWDATA and GWSI are subsystems of NWIS (National Water Inventory System)of the USGS (United States Geologic Survey). This map is for Grand County, Utah. The scope and purpose of NWIS is defined on the web site: http://water.usgs.gov/public/pubs/FS/FS-027-98/
These data were released prior to the October 1, 2016 effective date for the USGS’s policy dictating the review, approval, and release of scientific data as referenced in USGS Survey Manual Chapter 502.8 Fundamental Science Practices: Review and Approval of Scientific Data for Release. This map shows specific water-quality items and hydrologic data site information which come from QWDATA (Water Quality) and GWSI (Ground Water Information System). Both QWDATA and GWSI are subsystems of NWIS (National Water Inventory System)of the USGS (United States Geologic Survey). This map is for Tooele County, Utah. The scope and purpose of NWIS is defined on the web site: http://water.usgs.gov/public/pubs/FS/FS-027-98/
This dataset summarized a collection of annual thermal metrics to characterize lake temperature impacts on fish habitat for 7,150 lakes from uncalibrated models (PB0) and 449 from calibrated models (PBALL). The dataset includes over 172 annual thermal metrics.
This dataset contains .csv and .tif image files in support of the conclusions published in "Mediterranean California’s water use future under multiple scenarios of developed and agricultural land use change" in the journal PLOS One. We used the USGS's LUCAS model to examine a broad suite of spatially explicit future land use scenarios and their associated county-level water use demand, including the historical (1992-2011) and projected periods (2012-2062) across 40 Monte Carlo simulations.We examined a range of potential water demand futures sampled from a 20-year record of historical (1992-2012) data to develop a suite of potential future land change scenarios from 2012-2062. These scenario simulations include...
Categories: Data;
Types: Downloadable,
GeoTIFF,
Map Service,
Raster;
Tags: California,
California,
Central Valley,
LUCAS model,
Land Use Change,
|

|
