Filters: Tags: wyoming (X) > Date Range: {"choice":"year"} (X)
1,620 results (145ms)|
Filters
Date Types (for Date Range)
Types (Less)
Contacts (Less)
Categories (Less)
Tag Types
|
Layers of geospatial data include contours, boundaries, land cover, hydrography, roads, transportation, geographic names, structures, and other selected map features.
Layers of geospatial data include contours, boundaries, land cover, hydrography, roads, transportation, geographic names, structures, and other selected map features.
Layers of geospatial data include contours, boundaries, land cover, hydrography, roads, transportation, geographic names, structures, and other selected map features.
Types: Citation;
Tags: 7.5 x 7.5 minute,
7_5_Min,
Combined Vector,
Combined Vector,
Combined Vector,
Layers of geospatial data include contours, boundaries, land cover, hydrography, roads, transportation, geographic names, structures, and other selected map features.
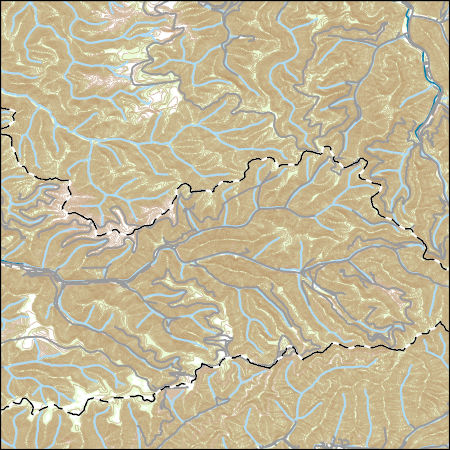
Layers of geospatial data include contours, boundaries, land cover, hydrography, roads, transportation, geographic names, structures, and other selected map features.
Estimation of irrigation water use provides essential information for the management and conservation of agricultural water resources. The blue water evapotranspiration (BWET) raster dataset at 30-meter resolution is created to estimate agricultural irrigation water consumption. The dataset contains seasonal total (1 May to 30 September) BWET time series (1986 – 2020) for the croplands across the U.S. High Plains aquifer region. The BWET estimates are generated by integrating an energy-balance ET model (Operational Simplified Surface Energy Balance model) and a water-balance ET model (Vegetation ET model). BWET in croplands reflects crop consumptive use of irrigation water extracted from surface water and groundwater...
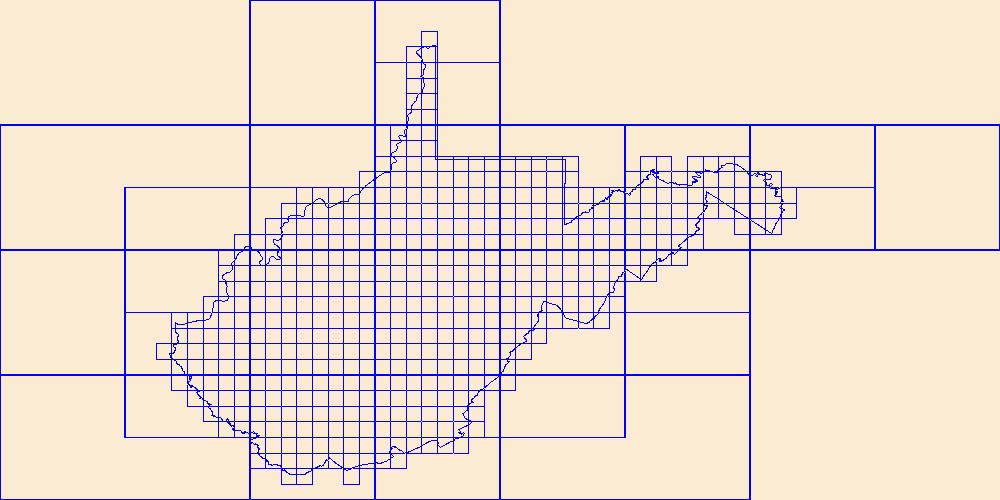
This data represents the map extent for current and historical USGS topographic maps for the United States and Territories, including 1 X 2 Degree, 1 X 1 Degree, 30 X 60 Minute, 15 X 15 Minute, 7.5 X 7.5 Minute, and 3.75 X 3.75 Minute. The grid was generated using ESRI ArcInfo GIS software.
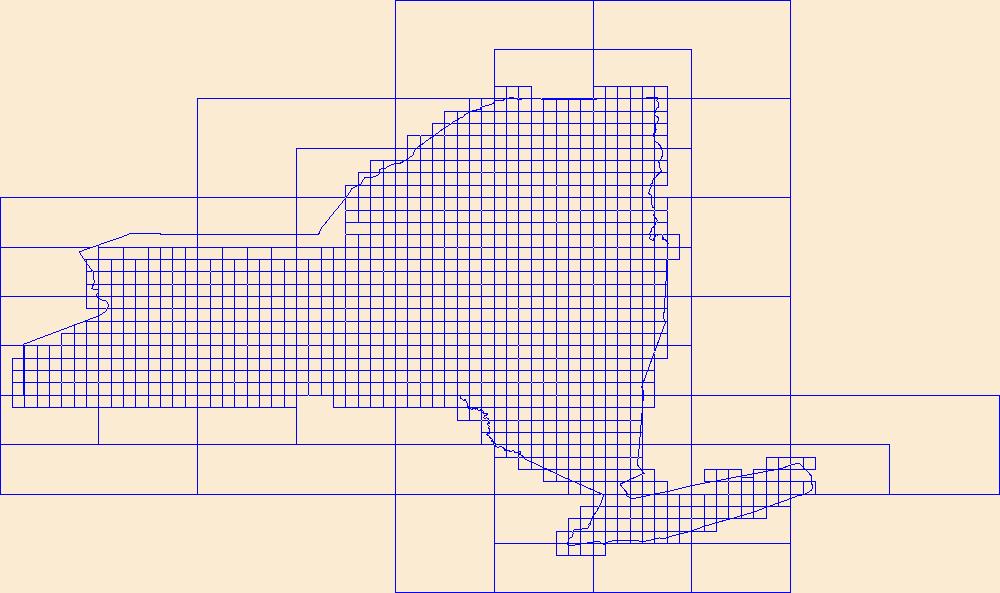
This data represents the map extent for current and historical USGS topographic maps for the United States and Territories, including 1 X 2 Degree, 1 X 1 Degree, 30 X 60 Minute, 15 X 15 Minute, 7.5 X 7.5 Minute, and 3.75 X 3.75 Minute. The grid was generated using ESRI ArcInfo GIS software.
Climate change over the past century has altered vegetation community composition and species distributions across rangelands in the western United States. The scale and magnitude of climatic influences are largely unknown. We used fractional component cover data for rangeland functional groups and weather data from the 1985 to 2023 reference period in conjunction with soils and topography data to develop empirical models describing the spatio-temporal variation in component cover. To investigate the ramifications of future change across the western US, we extended models based on historical relationships over the reference period to model landscape effects based on future weather conditions from two emissions scenarios...
The Wind River Reservation in Wyoming contains over 2 million acres of the best and most diverse and intact habitats in the contiguous US. It is home to the Eastern Shoshone and Northern Arapaho Tribes. In collaboration with Tribal Fish and Game, the USFWS Lander Fish and Wildlife Conservation Office and the USGS Wyoming Cooperative Research Unit, partners have been conducting an investigation of the migration patterns of 113 GPS-collared mule deer that began in 2018. As part of our SA diversity and inclusion efforts with a $60,500 investment, this project will extend the ongoing work and engage various segments of the tribal community in the research as a means to further understanding of fish and wildlife management...
Categories: Data,
Project;
Types: Map Service,
OGC WFS Layer,
OGC WMS Layer,
OGC WMS Service;
Tags: Project,
Rocky Mountain,
SA Science Catalog,
Strategic Science - 1420,
USFWS Science Applications Science Catalog,
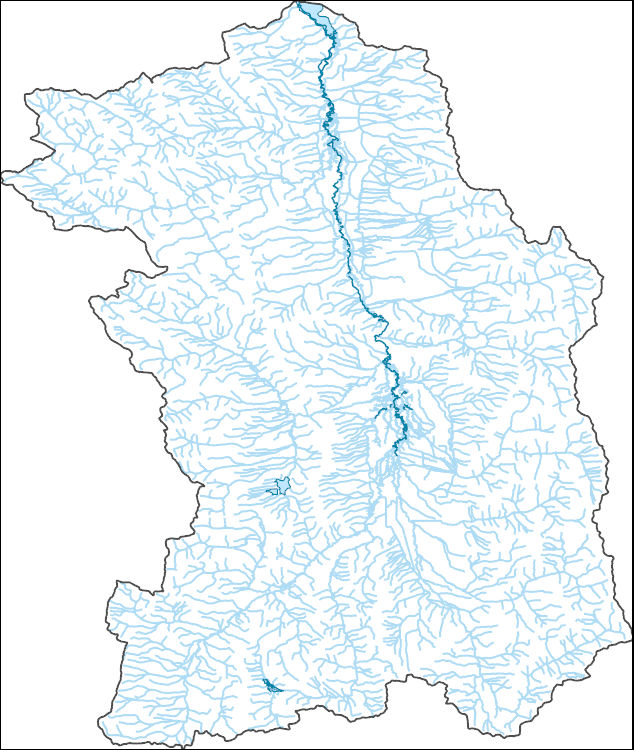
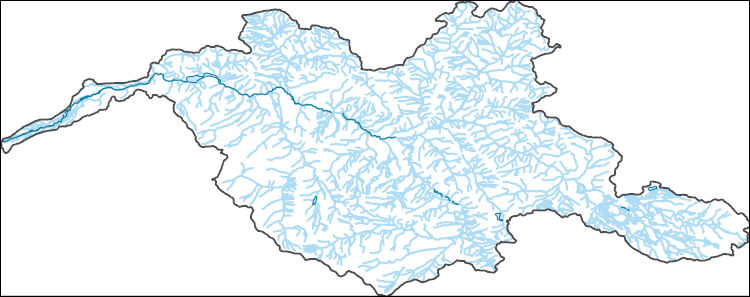
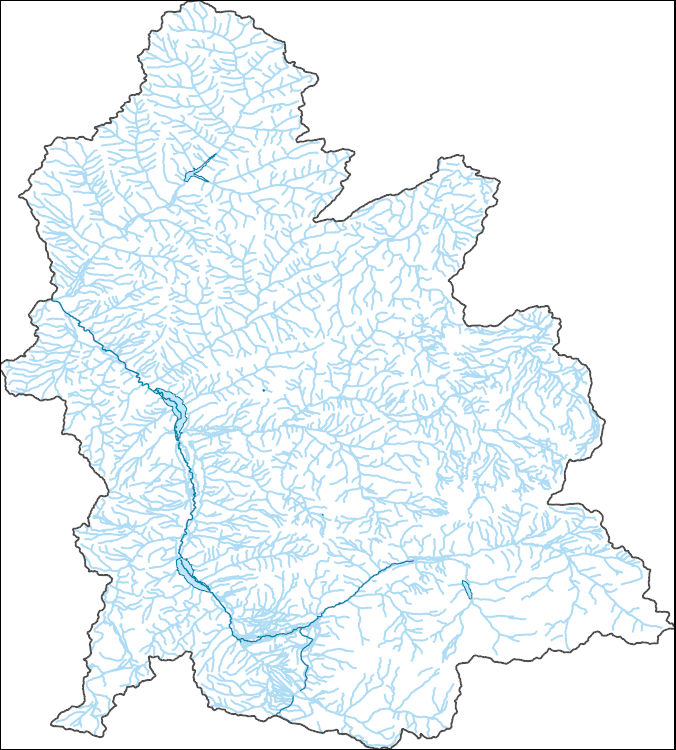
The National Hydrography Dataset (NHD) is a feature-based database that interconnects and uniquely identifies the stream segments or reaches that make up the nation's surface water drainage system. NHD data was originally developed at 1:100,000-scale and exists at that scale for the whole country. This high-resolution NHD, generally developed at 1:24,000/1:12,000 scale, adds detail to the original 1:100,000-scale NHD. (Data for Alaska, Puerto Rico and the Virgin Islands was developed at high-resolution, not 1:100,000 scale.) Local resolution NHD is being developed where partners and data exist. The NHD contains reach codes for networked features, flow direction, names, and centerline representations for areal water...
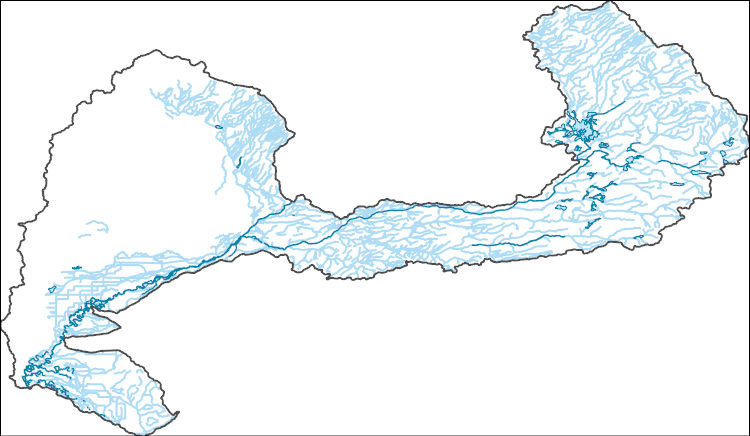
The National Hydrography Dataset (NHD) is a feature-based database that interconnects and uniquely identifies the stream segments or reaches that make up the nation's surface water drainage system. NHD data was originally developed at 1:100,000-scale and exists at that scale for the whole country. This high-resolution NHD, generally developed at 1:24,000/1:12,000 scale, adds detail to the original 1:100,000-scale NHD. (Data for Alaska, Puerto Rico and the Virgin Islands was developed at high-resolution, not 1:100,000 scale.) Local resolution NHD is being developed where partners and data exist. The NHD contains reach codes for networked features, flow direction, names, and centerline representations for areal water...
The National Hydrography Dataset (NHD) is a feature-based database that interconnects and uniquely identifies the stream segments or reaches that make up the nation's surface water drainage system. NHD data was originally developed at 1:100,000-scale and exists at that scale for the whole country. This high-resolution NHD, generally developed at 1:24,000/1:12,000 scale, adds detail to the original 1:100,000-scale NHD. (Data for Alaska, Puerto Rico and the Virgin Islands was developed at high-resolution, not 1:100,000 scale.) Local resolution NHD is being developed where partners and data exist. The NHD contains reach codes for networked features, flow direction, names, and centerline representations for areal water...
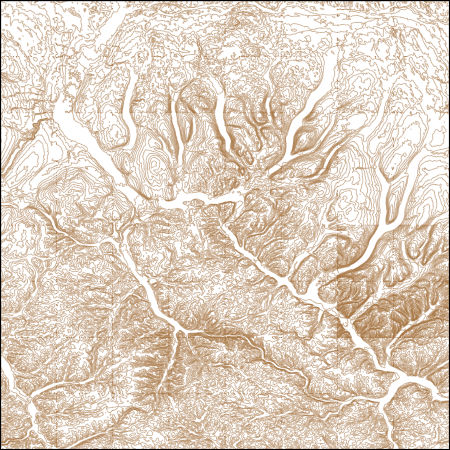
These vector contour lines are derived from the 3D Elevation Program using automated and semi-automated processes. They were created to support 1:24,000-scale CONUS and Hawaii, 1:25,000-scale Alaska, and 1:20,000-scale Puerto Rico / US Virgin Island topographic map products, but are also published in this GIS vector format. Contour intervals are assigned by 7.5-minute quadrangle, so this vector dataset is not visually seamless across quadrangle boundaries. The vector lines have elevation attributes (in feet above mean sea level on NAVD88), but this dataset does not carry line symbols or annotation.
This child item describes Python code used to estimate average yearly and monthly tourism per 1000 residents within public-supply water service areas. Increases in population due to tourism may impact amounts of water used by public-supply water systems. This data release contains model input datasets, Python code used to develop the tourism information, and output estimates of tourism. This dataset is part of a larger data release using machine learning to predict public supply water use for 12-digit hydrologic units from 2000-2020. Output from this code was used as an input feature in the public supply delivery and water use machine learning models. This page includes the following files: tourism_input_data.zip...
This child item describes a public supply delivery machine learning model that was developed to estimate public-supply deliveries. Publicly supplied water may be delivered to domestic users or to commercial, industrial, institutional, and irrigation (CII) users. This model predicts total, domestic, and CII per capita rates for public-supply water service areas within the conterminous United States for 2009-2020. This child item contains model input datasets, code used to build the delivery machine learning model, and national predictions. This dataset is part of a larger data release using machine learning to predict public-supply water use for 12-digit hydrologic units from 2000-2020. This page includes the following...
This child item describes Python code used to query census data from the TigerWeb Representational State Transfer (REST) services and the U.S. Census Bureau Application Programming Interface (API). These data were needed as input feature variables for a machine learning model to predict public supply water use for the conterminous United States. Census data were retrieved for public-supply water service areas, but the census data collector could be used to retrieve data for other areas of interest. This dataset is part of a larger data release using machine learning to predict public supply water use for 12-digit hydrologic units from 2000-2020. Data retrieved by the census data collector code were used as input...
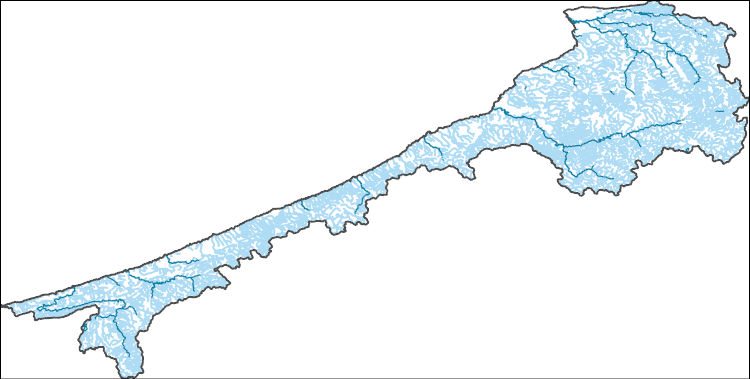
The National Hydrography Dataset (NHD) is a feature-based database that interconnects and uniquely identifies the stream segments or reaches that make up the nation's surface water drainage system. NHD data was originally developed at 1:100,000-scale and exists at that scale for the whole country. This high-resolution NHD, generally developed at 1:24,000/1:12,000 scale, adds detail to the original 1:100,000-scale NHD. (Data for Alaska, Puerto Rico and the Virgin Islands was developed at high-resolution, not 1:100,000 scale.) Local resolution NHD is being developed where partners and data exist. The NHD contains reach codes for networked features, flow direction, names, and centerline representations for areal water...
Oregon Buttes as seen form southwest near head of valley, passing John Hays' dipping pens. Wyoming. No Date.
The National Hydrography Dataset (NHD) is a feature-based database that interconnects and uniquely identifies the stream segments or reaches that make up the nation's surface water drainage system. NHD data was originally developed at 1:100,000-scale and exists at that scale for the whole country. This high-resolution NHD, generally developed at 1:24,000/1:12,000 scale, adds detail to the original 1:100,000-scale NHD. (Data for Alaska, Puerto Rico and the Virgin Islands was developed at high-resolution, not 1:100,000 scale.) Local resolution NHD is being developed where partners and data exist. The NHD contains reach codes for networked features, flow direction, names, and centerline representations for areal water...
|

|
