Filters: Tags: {"type":"Place","name":"texas"} (X) > partyWithName: U.S. Geological Survey (X)
36,685 results (109ms)|
Filters
Date Range
Extensions
Types Contacts
Categories Tag Schemes
|
Layers of geospatial data include contours, boundaries, land cover, hydrography, roads, transportation, geographic names, structures, and other selected map features.
Types: Citation;
Tags: 7.5 x 7.5 minute,
7.5 x 7.5 minute,
Combined Vector,
Combined Vector,
Combined Vector,
Field spikes were prepared at 207 stream and river sites as part of the U.S. Geological Survey (USGS) National Water Quality Assessment (NAWQA) project between December, 2012, and September, 2015. At the field site, a depth-and width-integrated environmental sample was collected, and one subsample of the environmental sample was spiked with a known amount of a spike mixture. Both the spiked subsample ("spike sample") and another subsample ("environmental sample") of the original water sample were analyzed for pesticides at the USGS National Water Quality Laboratory (NWQL) by direct injection liquid chromatography with tandem mass spectrometry (LC-MS/MS), and were used to calculate the spike recovery of each analyte....

This map layer consists of federally owned or administered lands of the United States, Puerto Rico, and the U.S. Virgin Islands. For the most part, only areas of 320 acres or more are included; some smaller areas deemed to be important or significant are also included. There may be private inholdings within the boundaries of Federal lands in this map layer. Some established Federal lands which are larger than 320 acres are not included in this map layer, because their boundaries were not available from the owning or administering agency.
Sediment samples and samples for water-toxicity testing were collected during 2014 from several streams in San Antonio, Texas known locally as the Westside creeks (Alazán, Apache, Martínez, and San Pedro Creeks) and from the San Antonio River. Samples were collected once during base-flow and again after periods of storm-water runoff (post-storm conditions) to determine baseline sediment- and water-quality conditions. Streambed-sediment samples were analyzed for selected constituents, including trace elements and organic contaminants such as pesticides, polychlorinated biphenyls (PCBs), brominated flame retardants, and polycyclic aromatic hydrocarbons (PAHs).
Categories: Data;
Tags: Alazán Creek,
Apache Creek,
Bexar County,
Brominated flame retardants,
Fathead minnow,
Layers of geospatial data include contours, boundaries, land cover, hydrography, roads, transportation, geographic names, structures, and other selected map features.
Layers of geospatial data include contours, boundaries, land cover, hydrography, roads, transportation, geographic names, structures, and other selected map features.
Types: Citation;
Tags: 7.5 x 7.5 minute,
7.5 x 7.5 minute,
Beauregard County,
Combined Vector,
Combined Vector,
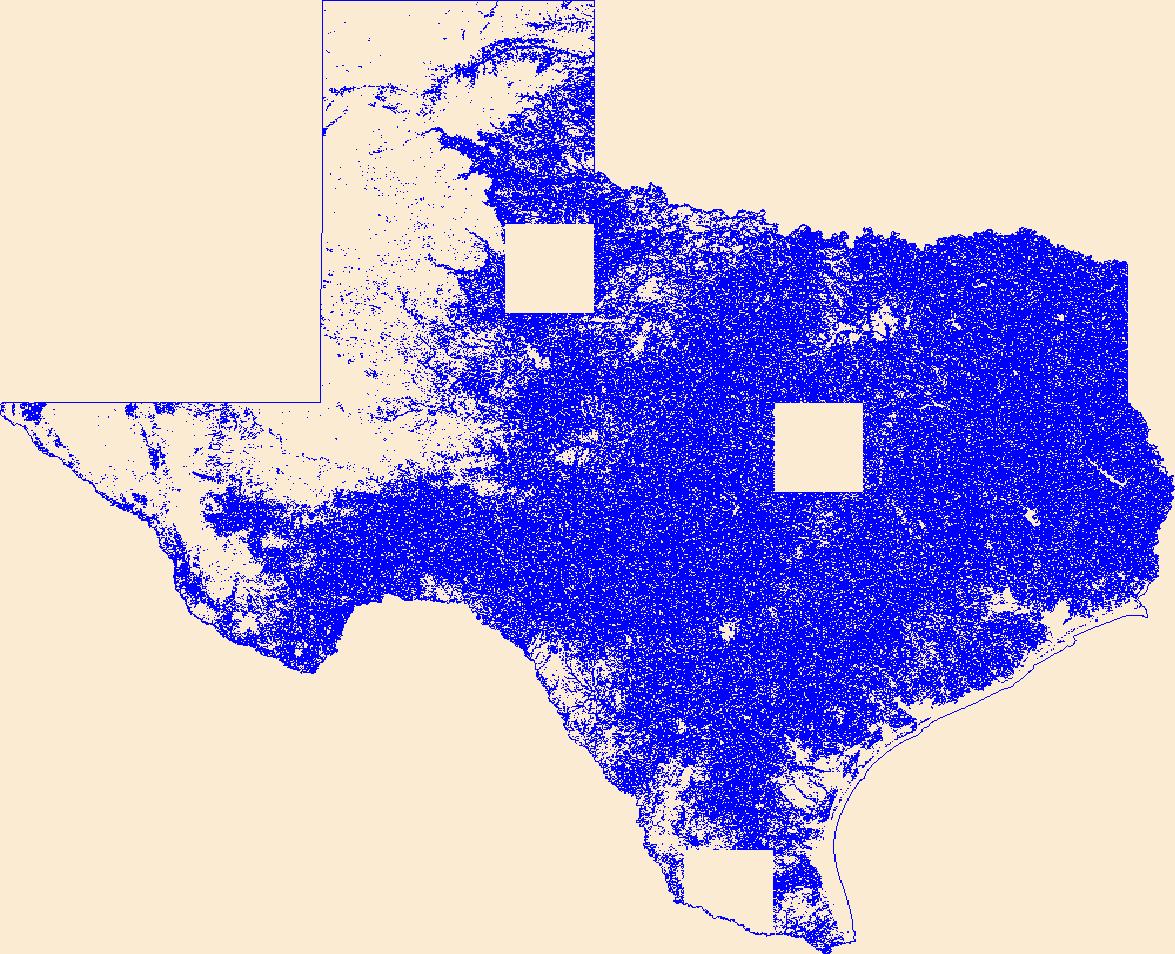
Geospatial data that is a derivative land cover product depicting woodland on topographic maps.
Hurricane Harvey made landfall near Rockport, Texas on August 25 as a category 4 hurricane with wind gusts exceeding 150 miles per hour. As Harvey moved inland the forward motion of the storm slowed down and produced tremendous rainfall amounts to southeastern Texas and southwestern Louisiana. Historic flooding occurred in Texas and Louisiana as a result of the widespread, heavy rainfall over an 8-day period in Louisiana in August and September 2017. Following the storm event, U.S. Geological Survey (USGS) hydrographers recovered and documented 2,123 high-water marks in Texas, noting location and height of the water above land surface. Many of these high-water marks were used to create flood-inundation maps for...
Types: Map Service,
OGC WFS Layer,
OGC WMS Layer,
OGC WMS Service;
Tags: Austin County,
Bellville,
Bessies Creek,
Booth,
Brazoria County,
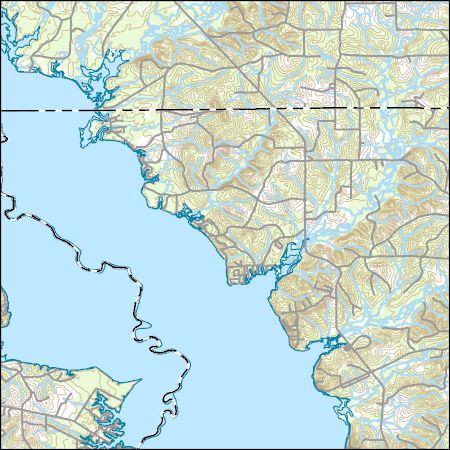
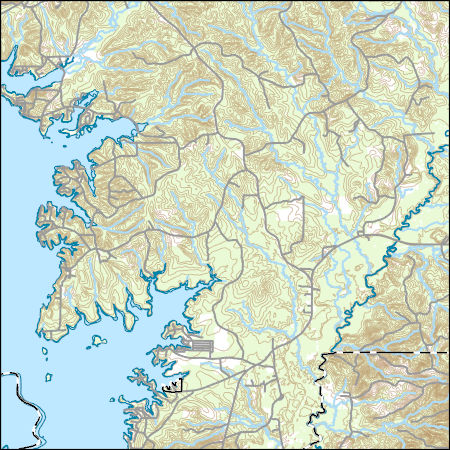
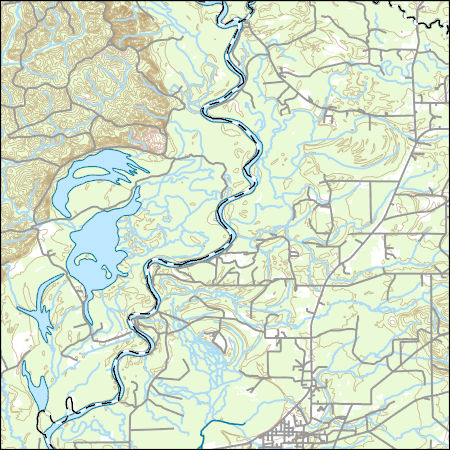
Layered GeoPDF 7.5 Minute Quadrangle Map. Layers of geospatial data include orthoimagery, roads, grids, geographic names, elevation contours, hydrography, and other selected map features.
Layered geospatial PDF Map. Layers of geospatial data include orthoimagery, roads, grids, geographic names, elevation contours, hydrography, and other selected map features.
Layered GeoPDF 7.5 Minute Quadrangle Map. Layers of geospatial data include orthoimagery, roads, grids, geographic names, elevation contours, hydrography, and other selected map features.
Layered GeoPDF 7.5 Minute Quadrangle Map. Layers of geospatial data include orthoimagery, roads, grids, geographic names, elevation contours, hydrography, and other selected map features.
Layered GeoPDF 7.5 Minute Quadrangle Map. Layers of geospatial data include orthoimagery, roads, grids, geographic names, elevation contours, hydrography, and other selected map features.
Layered GeoPDF 7.5 Minute Quadrangle Map. Layers of geospatial data include orthoimagery, roads, grids, geographic names, elevation contours, hydrography, and other selected map features.
Layered GeoPDF 7.5 Minute Quadrangle Map. Layers of geospatial data include orthoimagery, roads, grids, geographic names, elevation contours, hydrography, and other selected map features.
Layered GeoPDF 7.5 Minute Quadrangle Map. Layers of geospatial data include orthoimagery, roads, grids, geographic names, elevation contours, hydrography, and other selected map features.
|

|
