Filters: Tags: Nantucket (X)
101 results (110ms)|
Filters
Date Range
Extensions Types Contacts
Categories Tag Types Tag Schemes |
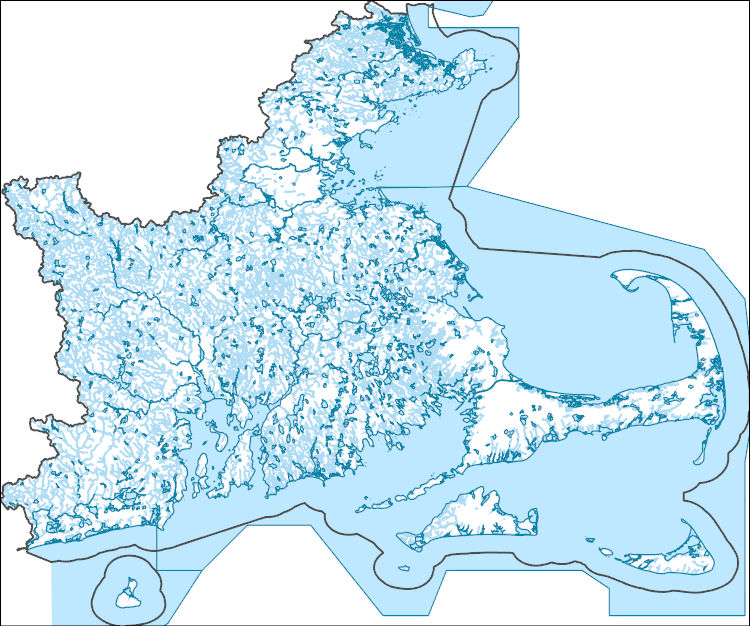
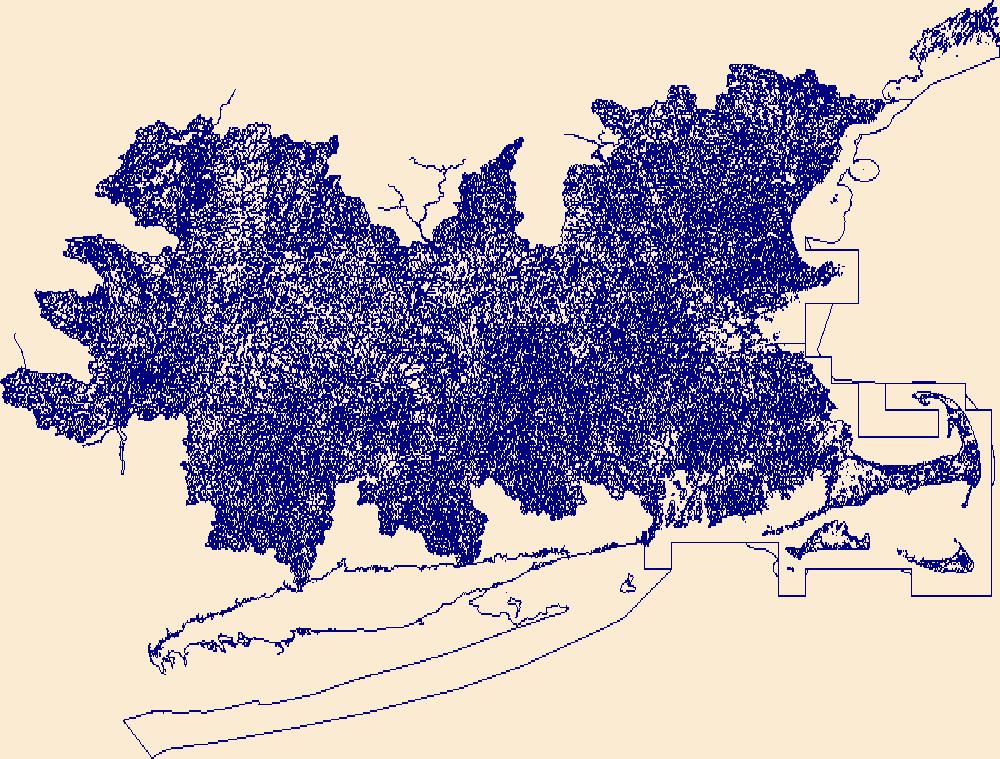
The National Hydrography Dataset (NHD) is a feature-based database that interconnects and uniquely identifies the stream segments or reaches that make up the nation's surface water drainage system. NHD data was originally developed at 1:100,000-scale and exists at that scale for the whole country. This high-resolution NHD, generally developed at 1:24,000/1:12,000 scale, adds detail to the original 1:100,000-scale NHD. (Data for Alaska, Puerto Rico and the Virgin Islands was developed at high-resolution, not 1:100,000 scale.) Local resolution NHD is being developed where partners and data exist. The NHD contains reach codes for networked features, flow direction, names, and centerline representations for areal water...
Geospatial data includes structures and other selected map features.
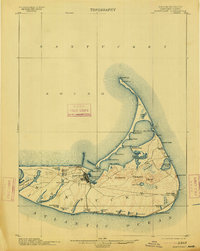
USGS Historical Quadrangle in GeoPDF.
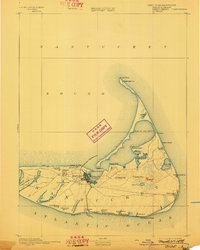
USGS Historical Quadrangle in GeoPDF.
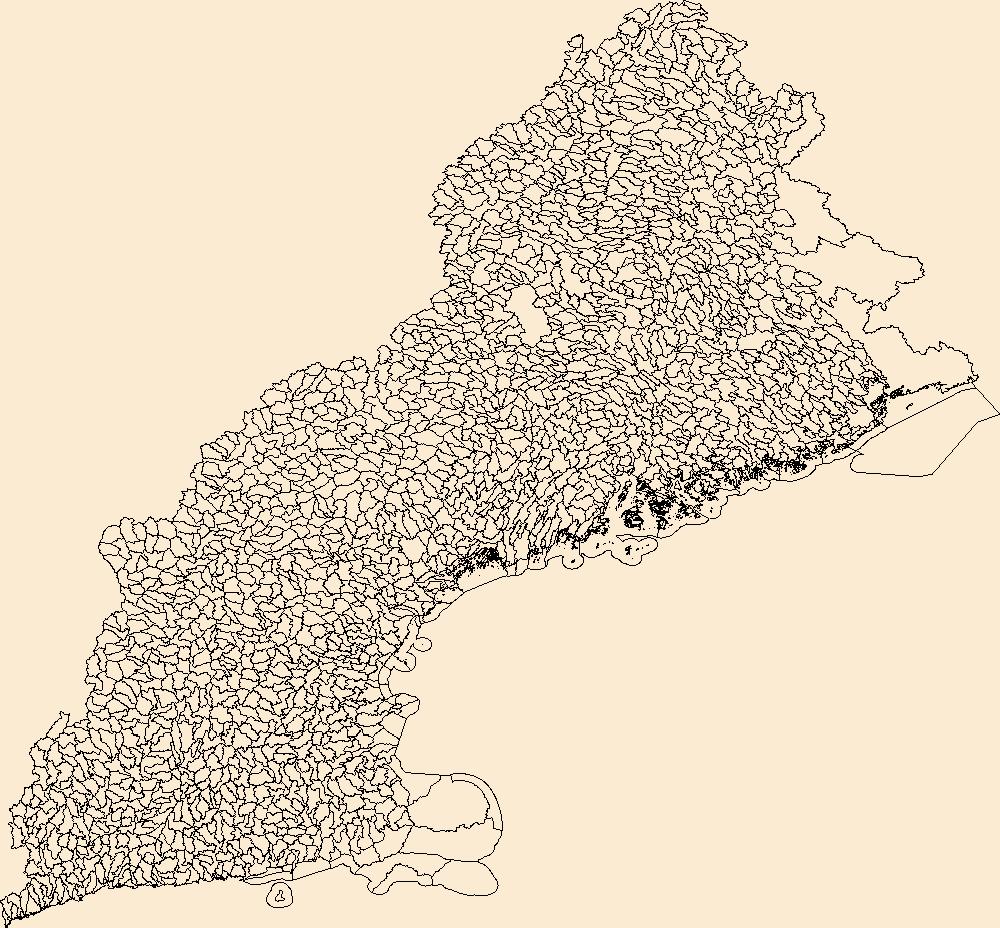
The Watershed Boundary Dataset (WBD) is a comprehensive aggregated collection of hydrologic unit data consistent with the national criteria for delineation and resolution. It defines the areal extent of surface water drainage to a point except in coastal or lake front areas where there could be multiple outlets as stated by the "Federal Standards and Procedures for the National Watershed Boundary Dataset (WBD)" "Standard" (https://pubs.usgs.gov/tm/11/a3/). Watershed boundaries are determined solely upon science-based hydrologic principles, not favoring any administrative boundaries or special projects, nor particular program or agency. This dataset represents the hydrologic unit boundaries to the 12-digit (6th level)...
This data release contains coastal wetland synthesis products for Massachusetts, developed in collaboration with the Massachusetts Office of Coastal Zone Management. Metrics for resiliency, including unvegetated to vegetated ratio (UVVR), marsh elevation, and tidal range are calculated for smaller units delineated from a digital elevation model, providing the spatial variability of physical factors that influence wetland health. The U.S. Geological Survey has been expanding national assessment of coastal change hazards and forecast products to coastal wetlands with the intent of providing Federal, State, and local managers with tools to estimate the vulnerability and ecosystem service potential of these wetlands....
Categories: Data;
Types: Downloadable,
Map Service,
OGC WFS Layer,
OGC WMS Layer,
Shapefile;
Tags: Buzzards Bay,
Cape Cod,
Cape Cod Bay,
Cape Cod National Seashore,
Danvers River,
The U.S. Geological Survey, in cooperation with the Massachusetts Office of Coastal Zone Management compiled Massachusetts vector shorelines into an updated dataset for the Office’s Shoreline Change Project. The Shoreline Change Project started in 1989 to identify erosion-prone areas of the Massachusetts coast by compiling a database of historical shoreline positions. Trends of shoreline position over long- and short-term timescales provide information to landowners, managers, and potential buyers about possible future changes to costal resources and infrastructure. This updated dataset strengthens the understanding of shoreline position change in Massachusetts. It includes U.S. Geological Survey vector shorelines...
Categories: Data;
Types: Downloadable,
Map Service,
OGC WFS Layer,
OGC WMS Layer,
Shapefile;
Tags: Atlantic Coast,
Buzzard’s Bay,
Cape Cod Bay,
Coastal and Marine Geology Program,
DSAS,
This data release contains coastal wetland synthesis products for Massachusetts, developed in collaboration with the Massachusetts Office of Coastal Zone Management. Metrics for resiliency, including unvegetated to vegetated ratio (UVVR), marsh elevation, and tidal range are calculated for smaller units delineated from a digital elevation model, providing the spatial variability of physical factors that influence wetland health. The U.S. Geological Survey has been expanding national assessment of coastal change hazards and forecast products to coastal wetlands with the intent of providing Federal, State, and local managers with tools to estimate the vulnerability and ecosystem service potential of these wetlands....
Layered GeoPDF 7.5 Minute Quadrangle Map. Layers of geospatial data include orthoimagery, roads, grids, geographic names, elevation contours, hydrography, and other selected map features.

The High Resolution National Hydrography Dataset Plus (NHDPlus HR) is an integrated set of geospatial data layers, including the National Hydrography Dataset (NHD), National Watershed Boundary Dataset (WBD), and 3D Elevation Program Digital Elevation Model (3DEP DEM). The NHDPlus HR combines the NHD, 3DEP DEMs, and WBD to a data suite that includes the NHD stream network with linear referencing functionality, the WBD hydrologic units, elevation-derived catchment areas for each stream segment, "value added attributes" (VAAs), and other features that enhance hydrologic data analysis and routing.
Two marine geological surveys were conducted in Nantucket Sound, Massachusetts, in May 2016 and May 2017 by the U.S. Geological Survey as part of an agreement with the Massachusetts Office of Coastal Zone Management to map the geology of the sea floor offshore of Massachusetts. Samples of surficial sediment and photographs of the sea floor were collected at 76 sampling sites within the survey area, and sea-floor videos were collected at 75 of the sites. The sediment data and the observations from the photos and videos are used to explore the nature of the sea floor; in conjunction with high-resolution geophysical data, the observations are used to make interpretive maps of sedimentary environments and validate acoustic...
Categories: Data;
Types: Downloadable,
Map Service,
OGC WFS Layer,
OGC WMS Layer,
Shapefile;
Tags: Atlantic Ocean,
CMHRP,
CZM,
Coastal and Marine Hazards and Resources Program,
MA CZM,
This data release contains coastal wetland synthesis products for Massachusetts, developed in collaboration with the Massachusetts Office of Coastal Zone Management. Metrics for resiliency, including unvegetated to vegetated ratio (UVVR), marsh elevation, and tidal range are calculated for smaller units delineated from a digital elevation model, providing the spatial variability of physical factors that influence wetland health. The U.S. Geological Survey has been expanding national assessment of coastal change hazards and forecast products to coastal wetlands with the intent of providing Federal, State, and local managers with tools to estimate the vulnerability and ecosystem service potential of these wetlands....
Categories: Data;
Types: Downloadable,
Map Service,
OGC WFS Layer,
OGC WMS Layer,
Shapefile;
Tags: Buzzards Bay,
Cape Cod,
Cape Cod Bay,
Cape Cod National Seashore,
Danvers River,
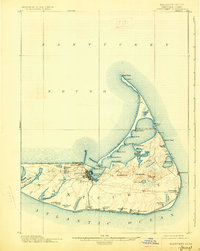
USGS Historical Quadrangle in GeoPDF.
USGS National Hydrography Dataset Best Resolution (NHD) - Massachusetts (published 20231227) FileGDB
The National Hydrography Dataset (NHD) is a feature-based database that interconnects and uniquely identifies the stream segments or reaches that make up the nation's surface water drainage system. NHD data was originally developed at 1:100,000-scale and exists at that scale for the whole country. This high-resolution NHD, generally developed at 1:24,000/1:12,000 scale, adds detail to the original 1:100,000-scale NHD. (Data for Alaska, Puerto Rico and the Virgin Islands was developed at high-resolution, not 1:100,000 scale.) Local resolution NHD is being developed where partners and data exist. The NHD contains reach codes for networked features, flow direction, names, and centerline representations for areal water...
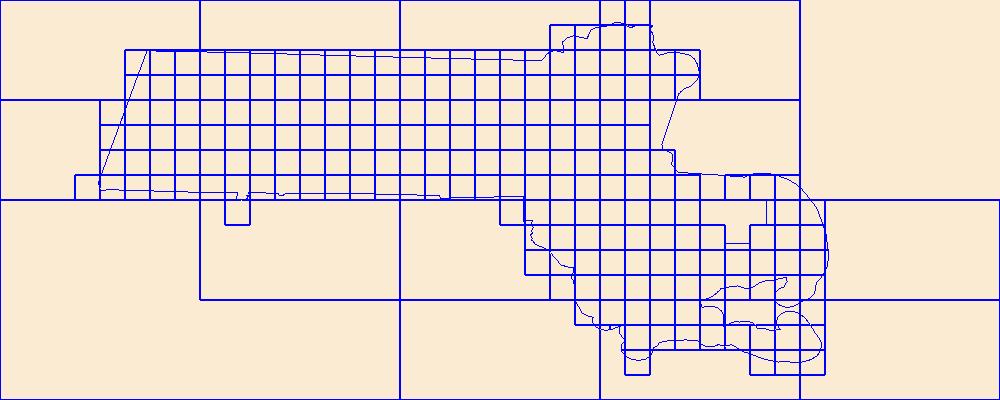
This data represents the map extent for current and historical USGS topographic maps for the United States and Territories, including 1 X 2 Degree, 1 X 1 Degree, 30 X 60 Minute, 15 X 15 Minute, 7.5 X 7.5 Minute, and 3.75 X 3.75 Minute. The grid was generated using ESRI ArcInfo GIS software.
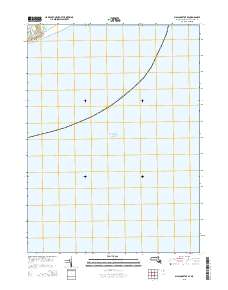
Layered GeoPDF 7.5 Minute Quadrangle Map. Layers of geospatial data include orthoimagery, roads, grids, geographic names, elevation contours, hydrography, and other selected map features.
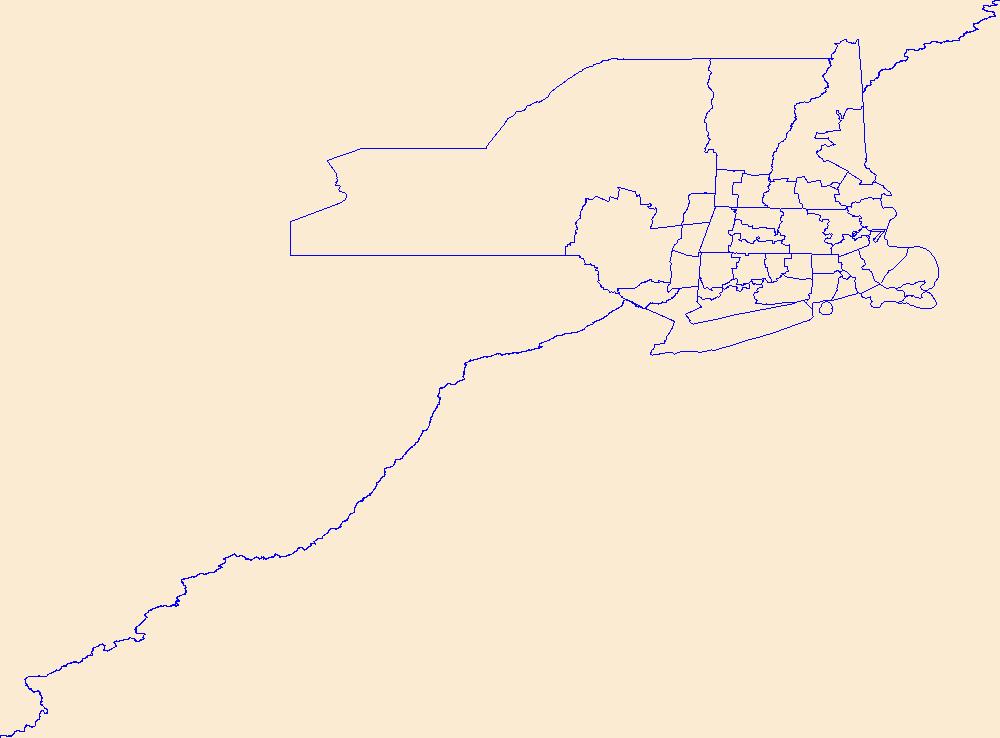
Geospatial data is comprised of government boundaries.
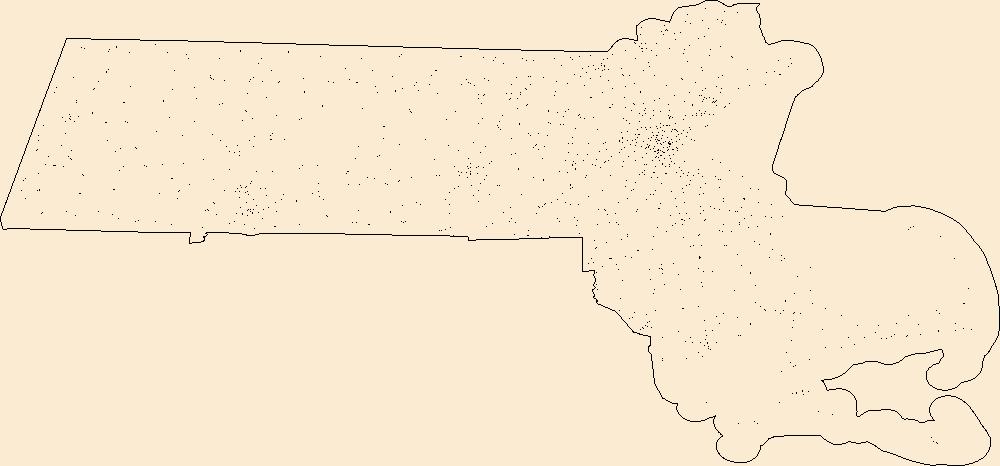
The Geographic Names Information System (GNIS) is the Federal standard for geographic nomenclature. The U.S. Geological Survey developed the GNIS for the U.S. Board on Geographic Names, a Federal inter-agency body chartered by public law to maintain uniform feature name usage throughout the Government and to promulgate standard names to the public. The GNIS is the official repository of domestic geographic names data; the official vehicle for geographic names use by all departments of the Federal Government; and the source for applying geographic names to Federal electronic and printed products of all types.
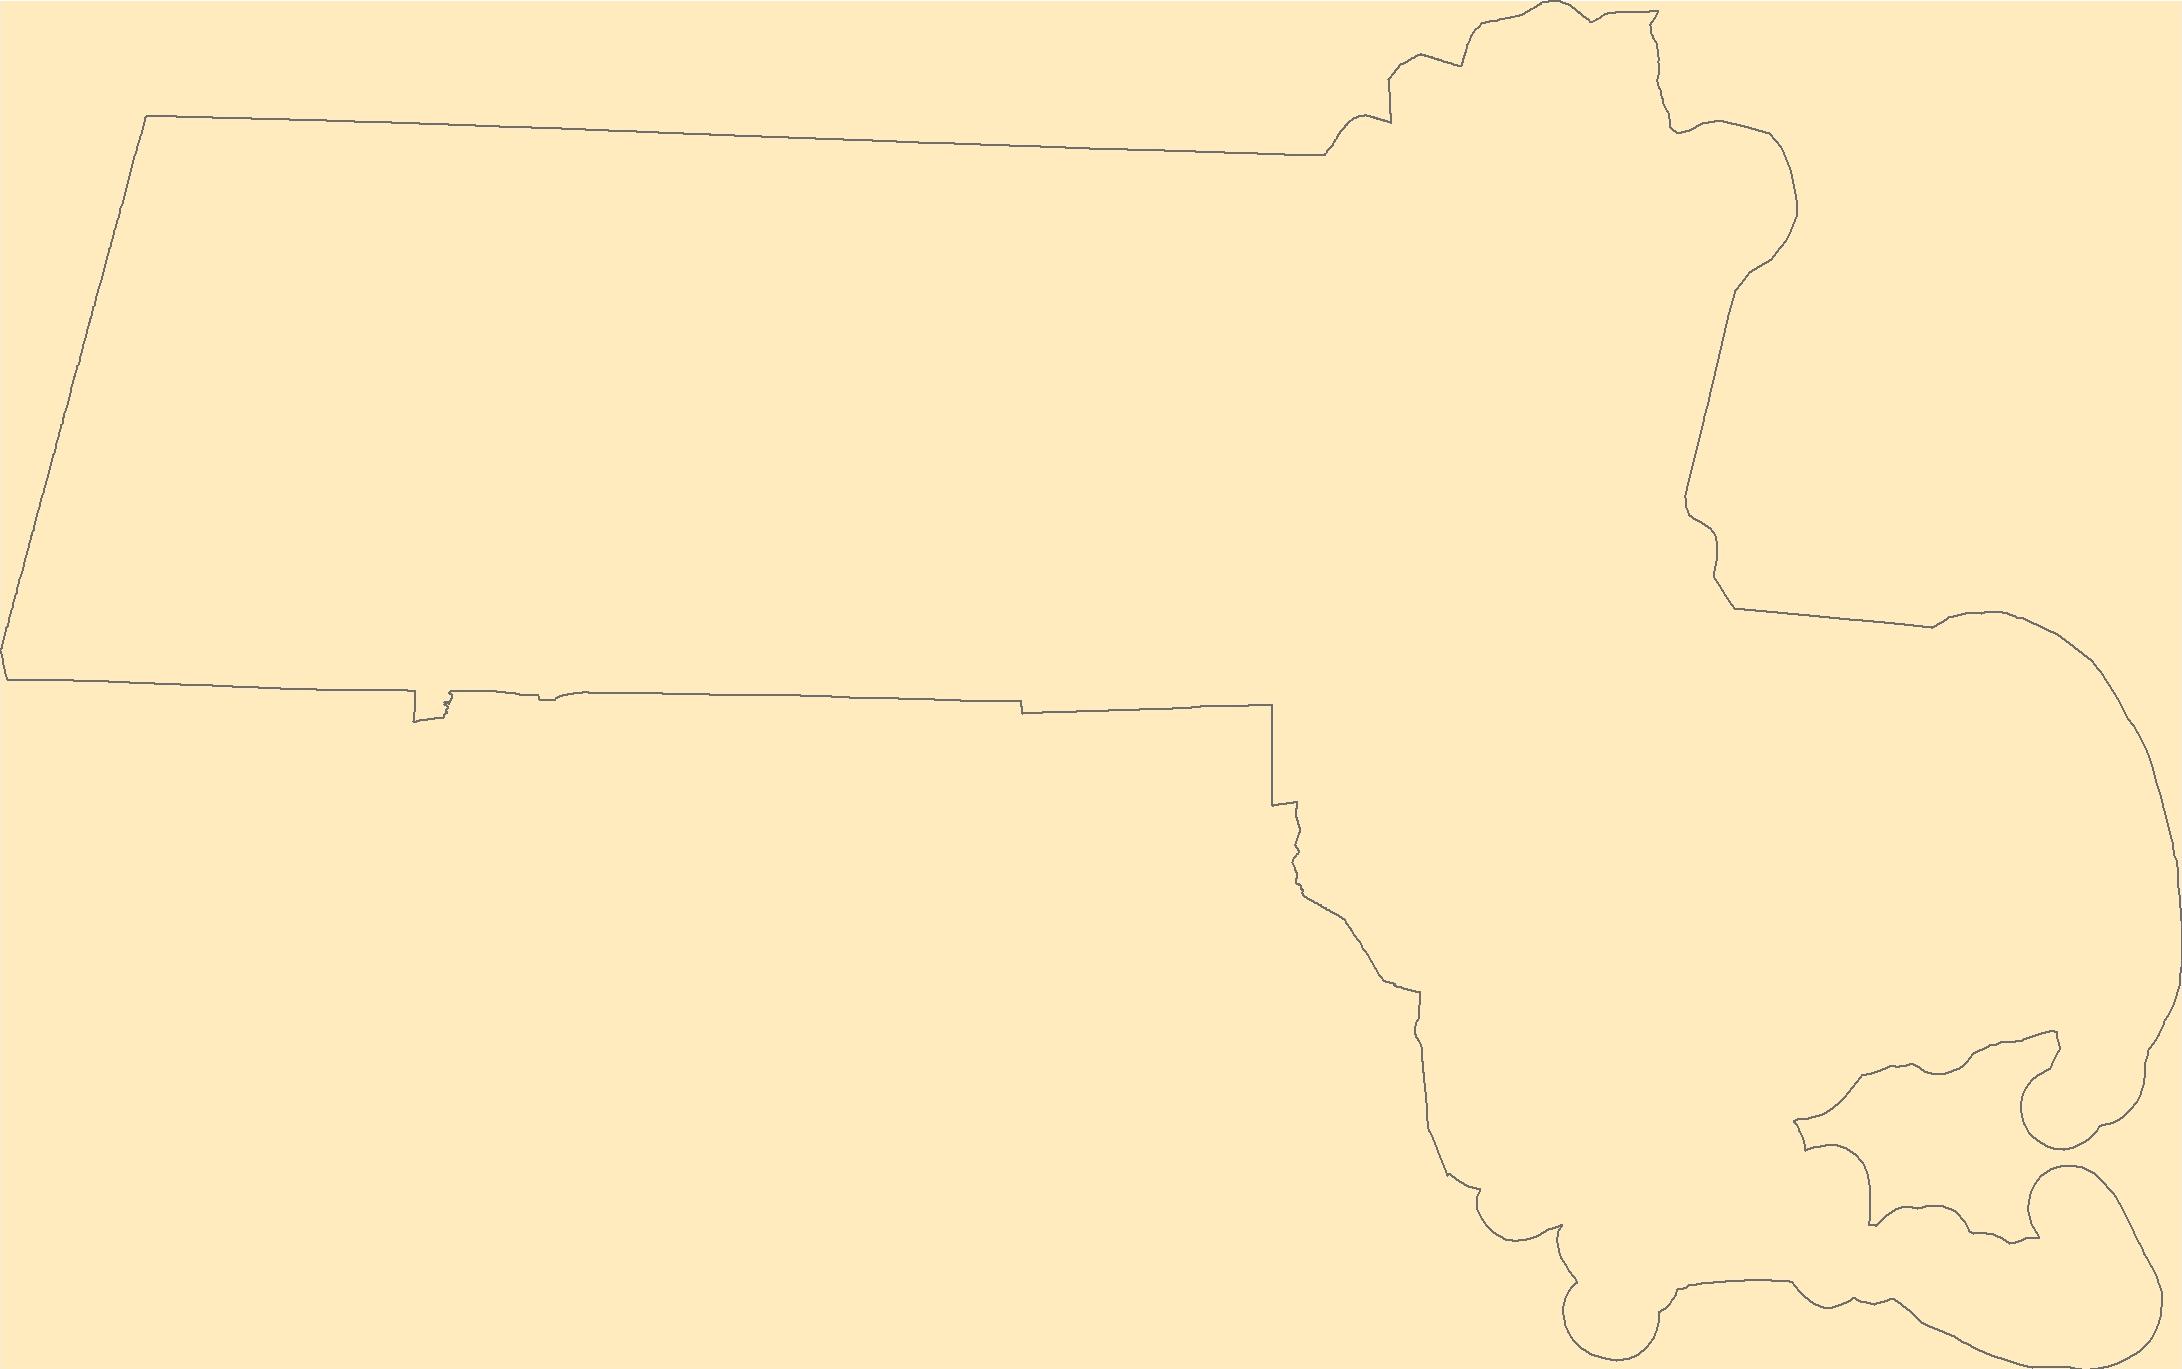
Integrated terrain models covering 16,357 square kilometers of the Massachusetts coastal zone and offshore waters were built to provide a continuous elevation and bathymetry terrain model for ocean planning purposes. The area is divided into the following four geographical areas to reduce file size and facilitate publishing: Massachusetts Bay from the Massachusetts-New Hampshire border south to Provincetown and Scituate and east to Stellwagen Bank; Cape Cod Bay from Provincetown to Scituate and south to Hyannis; Buzzards Bay from the Cape Cod Canal southwest to the State border including the Elizabeth Islands and extending north to Fall River and Mount Hope Bay; and Nantucket and Vineyard Sounds, from Hyannis south...
|

|
