Filters: Tags: Whatcom County (X)
169 results (104ms)|
Filters
Date Range
Types Contacts
Categories Tag Types
|
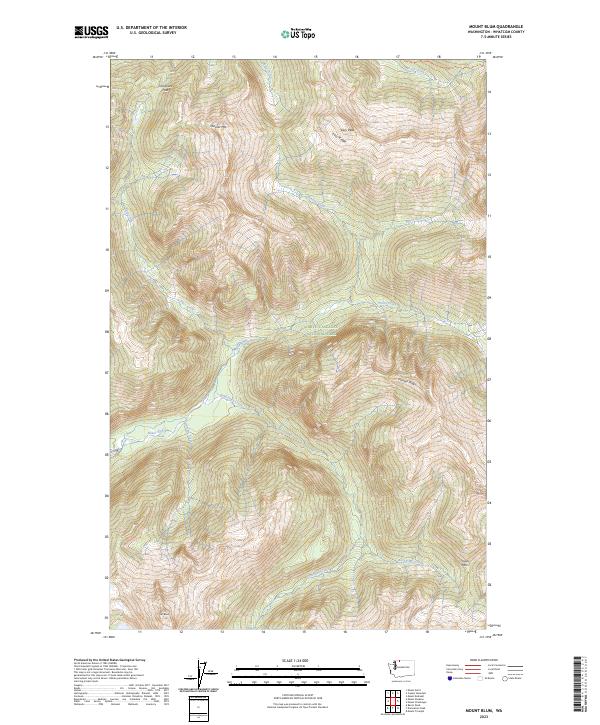
Layered geospatial PDF 7.5 Minute Quadrangle Map. Layers of geospatial data include orthoimagery, roads, grids, geographic names, elevation contours, hydrography, and other selected map features. This map is derived from GIS (geospatial information system) data. It represents a repackaging of GIS data in traditional map form, not creation of new information. The geospatial data in this map are from selected National Map data holdings and other government sources.
Layered geospatial PDF 7.5 Minute Quadrangle Map. Layers of geospatial data include orthoimagery, roads, grids, geographic names, elevation contours, hydrography, and other selected map features. This map is derived from GIS (geospatial information system) data. It represents a repackaging of GIS data in traditional map form, not creation of new information. The geospatial data in this map are from selected National Map data holdings and other government sources.
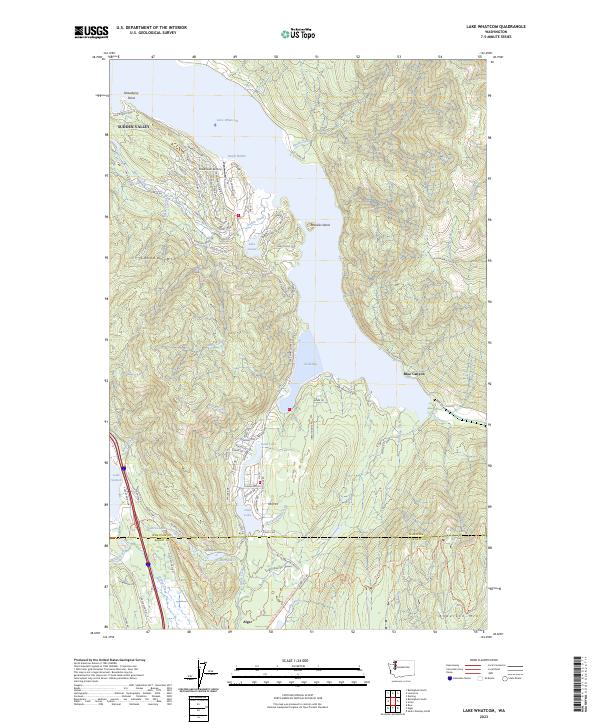
Layered geospatial PDF 7.5 Minute Quadrangle Map. Layers of geospatial data include orthoimagery, roads, grids, geographic names, elevation contours, hydrography, and other selected map features. This map is derived from GIS (geospatial information system) data. It represents a repackaging of GIS data in traditional map form, not creation of new information. The geospatial data in this map are from selected National Map data holdings and other government sources.
Layered geospatial PDF 7.5 Minute Quadrangle Map. Layers of geospatial data include orthoimagery, roads, grids, geographic names, elevation contours, hydrography, and other selected map features. This map is derived from GIS (geospatial information system) data. It represents a repackaging of GIS data in traditional map form, not creation of new information. The geospatial data in this map are from selected National Map data holdings and other government sources.
Layered geospatial PDF 7.5 Minute Quadrangle Map. Layers of geospatial data include orthoimagery, roads, grids, geographic names, elevation contours, hydrography, and other selected map features. This map is derived from GIS (geospatial information system) data. It represents a repackaging of GIS data in traditional map form, not creation of new information. The geospatial data in this map are from selected National Map data holdings and other government sources.
Layered geospatial PDF 7.5 Minute Quadrangle Map. Layers of geospatial data include orthoimagery, roads, grids, geographic names, elevation contours, hydrography, and other selected map features. This map is derived from GIS (geospatial information system) data. It represents a repackaging of GIS data in traditional map form, not creation of new information. The geospatial data in this map are from selected National Map data holdings and other government sources.
Eelgrass and substrate characteristics in Bellingham Bay, Washington, July 2019 and July-August 2020
Eelgrass (Zostera marina) characteristics, sediment grain size distributions, sediment total organic carbon contents (TOC), carbon isotope ratios of sediment organic matter, and total carbon to total nitrogen ratios were measured at four lower intertidal sites in Bellingham Bay, Washington, July 2-5, 2019, and three subtidal sites (grain-size and TOC only) on July 11, 2019.
Geochemical data are reported for surface sediments and long sediment cores from Bellingham Bay, Whatcom County, Washington, collected in early February 2020 after flood conditions on the Nooksack River. Data include total organic carbon content (TOC), carbonate content (CaCO3), ratios of stable carbon 13/12 isotopes (d13C), ratios of total carbon to total nitrogen (C:N), short-lived cosmogenic radionuclide activities (Beryllium-7, Cesium-137, and excess Lead-210), and elemental chemistry.
Categories: Data;
Tags: Bellingham Bay,
CMHRP,
Coastal and Marine Hazards and Resources Program,
Geochemistry,
Mercury analysis,
This portion of the data release presents digital surface models (DSMs) and hillshade images of the intertidal zone at Post Point, Bellingham Bay, WA. The DSMs were derived from structure-from-motion (SfM) processing of aerial imagery collected with an unmanned aerial system (UAS) on 2019-06-06. Unlike a digital elevation model (DEM), the DSMs represent the elevation of the highest object within the bounds of a cell. Vegetation, buildings and other objects have not been removed from the data. In addition, data artifacts resulting from noise in the original imagery have not been removed. The DSMs are presented with two resolutions: one DSM, covering the entire survey area, has a resolution of 4 centimeters per pixel;...
Layered geospatial PDF 7.5 Minute Quadrangle Map. Layers of geospatial data include orthoimagery, roads, grids, geographic names, elevation contours, hydrography, and other selected map features. This map is derived from GIS (geospatial information system) data. It represents a repackaging of GIS data in traditional map form, not creation of new information. The geospatial data in this map are from selected National Map data holdings and other government sources.
Layered geospatial PDF 7.5 Minute Quadrangle Map. Layers of geospatial data include orthoimagery, roads, grids, geographic names, elevation contours, hydrography, and other selected map features. This map is derived from GIS (geospatial information system) data. It represents a repackaging of GIS data in traditional map form, not creation of new information. The geospatial data in this map are from selected National Map data holdings and other government sources.
Layered geospatial PDF 7.5 Minute Quadrangle Map. Layers of geospatial data include orthoimagery, roads, grids, geographic names, elevation contours, hydrography, and other selected map features. This map is derived from GIS (geospatial information system) data. It represents a repackaging of GIS data in traditional map form, not creation of new information. The geospatial data in this map are from selected National Map data holdings and other government sources.
Layered geospatial PDF 7.5 Minute Quadrangle Map. Layers of geospatial data include orthoimagery, roads, grids, geographic names, elevation contours, hydrography, and other selected map features. This map is derived from GIS (geospatial information system) data. It represents a repackaging of GIS data in traditional map form, not creation of new information. The geospatial data in this map are from selected National Map data holdings and other government sources.
Layered geospatial PDF 7.5 Minute Quadrangle Map. Layers of geospatial data include orthoimagery, roads, grids, geographic names, elevation contours, hydrography, and other selected map features. This map is derived from GIS (geospatial information system) data. It represents a repackaging of GIS data in traditional map form, not creation of new information. The geospatial data in this map are from selected National Map data holdings and other government sources.
Layered geospatial PDF 7.5 Minute Quadrangle Map. Layers of geospatial data include orthoimagery, roads, grids, geographic names, elevation contours, hydrography, and other selected map features. This map is derived from GIS (geospatial information system) data. It represents a repackaging of GIS data in traditional map form, not creation of new information. The geospatial data in this map are from selected National Map data holdings and other government sources.
Layered geospatial PDF 7.5 Minute Quadrangle Map. Layers of geospatial data include orthoimagery, roads, grids, geographic names, elevation contours, hydrography, and other selected map features. This map is derived from GIS (geospatial information system) data. It represents a repackaging of GIS data in traditional map form, not creation of new information. The geospatial data in this map are from selected National Map data holdings and other government sources.
Layered geospatial PDF 7.5 Minute Quadrangle Map. Layers of geospatial data include orthoimagery, roads, grids, geographic names, elevation contours, hydrography, and other selected map features. This map is derived from GIS (geospatial information system) data. It represents a repackaging of GIS data in traditional map form, not creation of new information. The geospatial data in this map are from selected National Map data holdings and other government sources.
Layered geospatial PDF 7.5 Minute Quadrangle Map. Layers of geospatial data include orthoimagery, roads, grids, geographic names, elevation contours, hydrography, and other selected map features. This map is derived from GIS (geospatial information system) data. It represents a repackaging of GIS data in traditional map form, not creation of new information. The geospatial data in this map are from selected National Map data holdings and other government sources.
Layered geospatial PDF 7.5 Minute Quadrangle Map. Layers of geospatial data include orthoimagery, roads, grids, geographic names, elevation contours, hydrography, and other selected map features. This map is derived from GIS (geospatial information system) data. It represents a repackaging of GIS data in traditional map form, not creation of new information. The geospatial data in this map are from selected National Map data holdings and other government sources.
Nitrate contamination of groundwater is widespread and persistent in the shallow surficial aquifer of northwestern Whatcom County where dairy farming and forage production is a primary land-use activity. Application of dairy manure to cropland is intended to provide nutrients for crop growth and improve soil quality with the ideal goal to match the rate of nutrient application to that rate of nutrient removal by the crop. A study to test an alternate strategy for scheduling manure application to fields based on hydrologic properties of specific soils and fields, measurements of manure and soil parameters, and current and forecasted precipitation for the three days immediately following manure application is being...
Categories: Data;
Types: Citation;
Tags: Sumas-Blaine Aquifer,
USGS Science Data Catalog (SDC),
Washington,
Water Quality,
Whatcom County,
|

|
