Filters: Tags: {"scheme":"U.S. Department of Commerce; 2013; American National Standards Institute (ANSI) Codes for States, the District of Columbia, Puerto Rico, and the Insular Areas of the United States; Washington, DC; U.S. Census Bureau; http://www.census.gov/geo/reference/ansi_statetables.html."} (X) > Types: Citation (X)
28 results (576ms)|
Filters
Date Range
Contacts (Less)
Tag Types Tags (with Scheme=U.S. Department of Commerce; 2013; American National Standards Institute (ANSI) Codes for States, the District of Columbia, Puerto Rico, and the Insular Areas of the United States; Washington, DC; U.S. Census Bureau; http://www.census.gov/geo/reference/ansi_statetables.html.) |

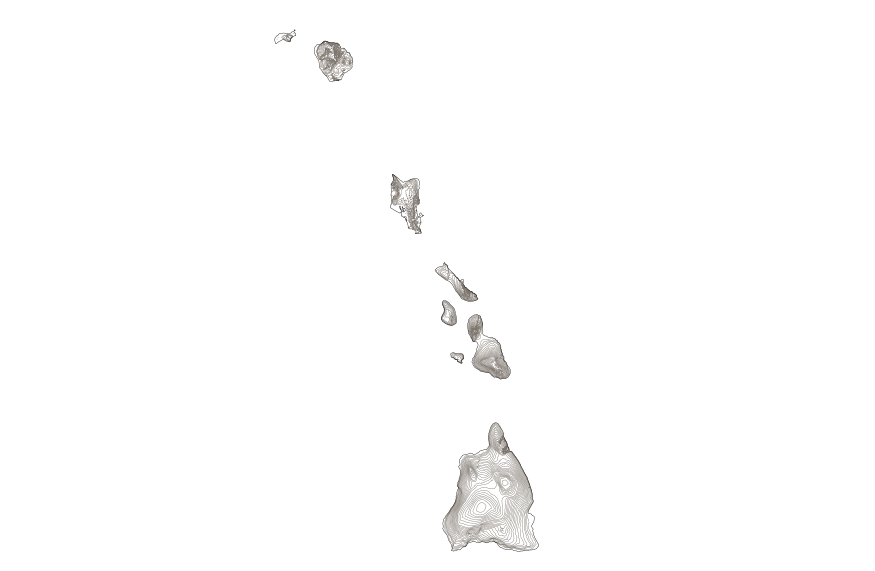
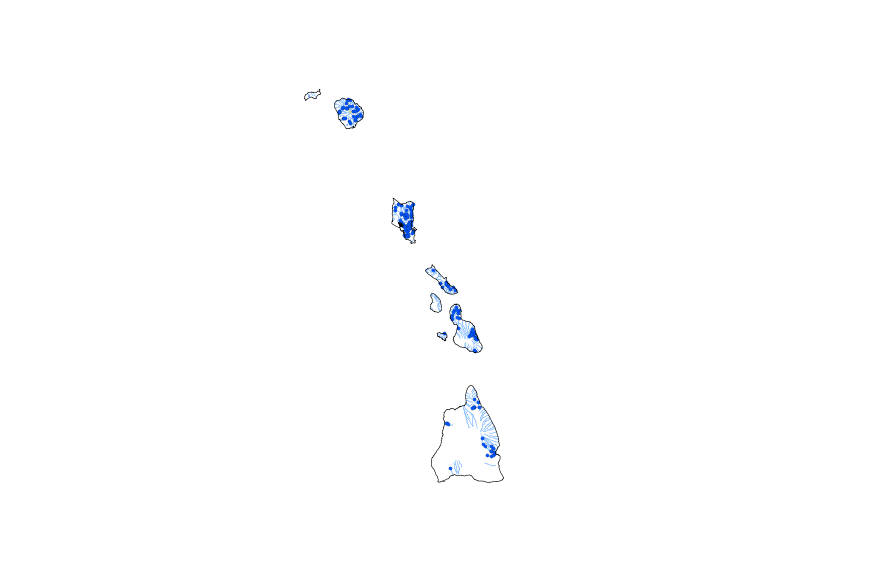
This map layer shows elevation contour lines for Hawaii. The map layer was derived from the 100-meter resolution elevation data set which is published by the National Atlas of the United States, and is in the same Albers Equal-area Conic projection as that source data set. Contour intervals match the steps used in the National Atlas Color-Sliced Elevation data sets. Contours were adjusted so that they are in the proper relationship to National Atlas 1:1,000,000-scale lakes, reservoirs, and wide (double-line) streams.
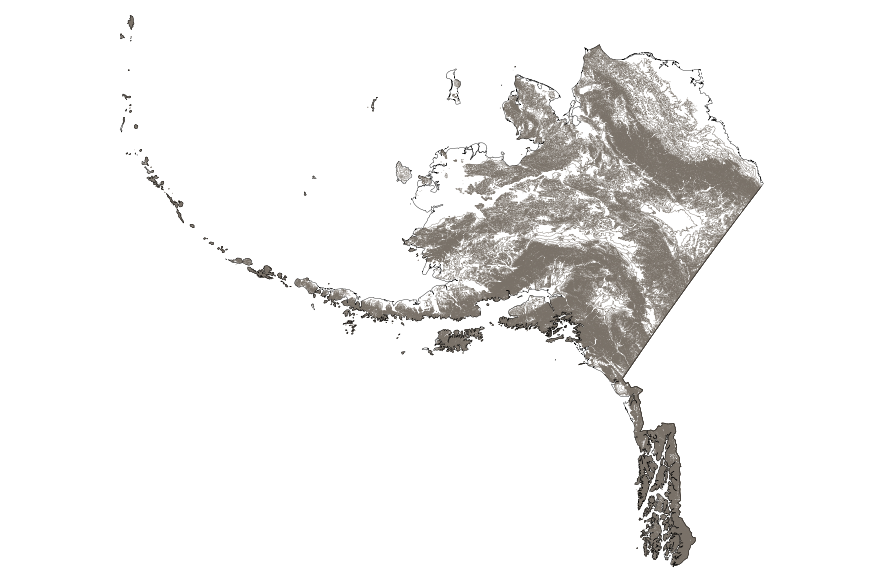
This map layer shows elevation contour lines for Alaska. The map layer was derived from the 100-meter resolution elevation data set which is published by the National Atlas of the United States, and is in the same Albers Equal-area Conic projection as that source data set. Contour intervals match the steps used in the National Atlas Color-Sliced Elevation data sets. Contours were adjusted so that they are in the proper relationship to National Atlas 1:1,000,000-scale lakes, reservoirs, and wide (double-line) streams.

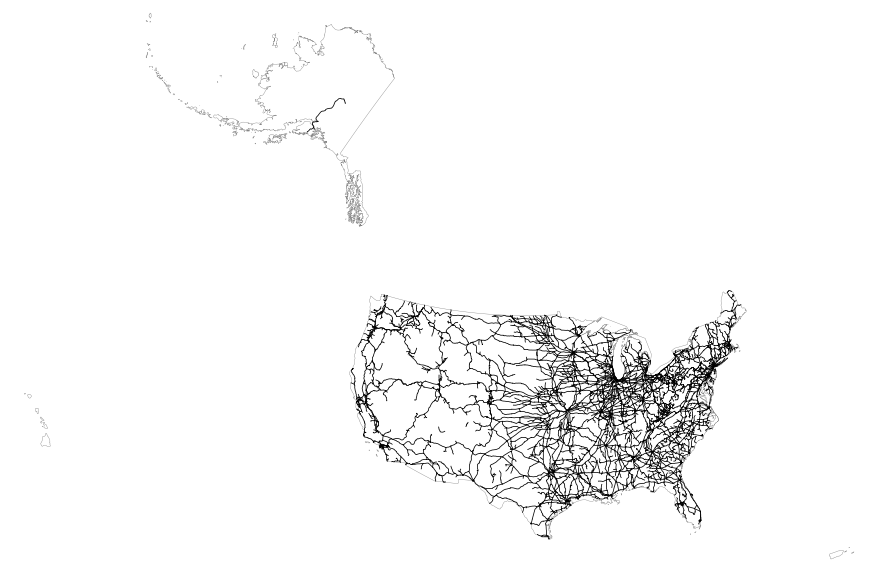
This map layer portrays the major roads in the United States, Puerto Rico, and the U.S. Virgin Islands. The file was produced by joining the individual State roads layers from the National Highway Planning Network (NHPN), Geographic Data Technology (GDT) Dynamap, and TIGER/Line files. This is a revised version of the July 2012 map layer.
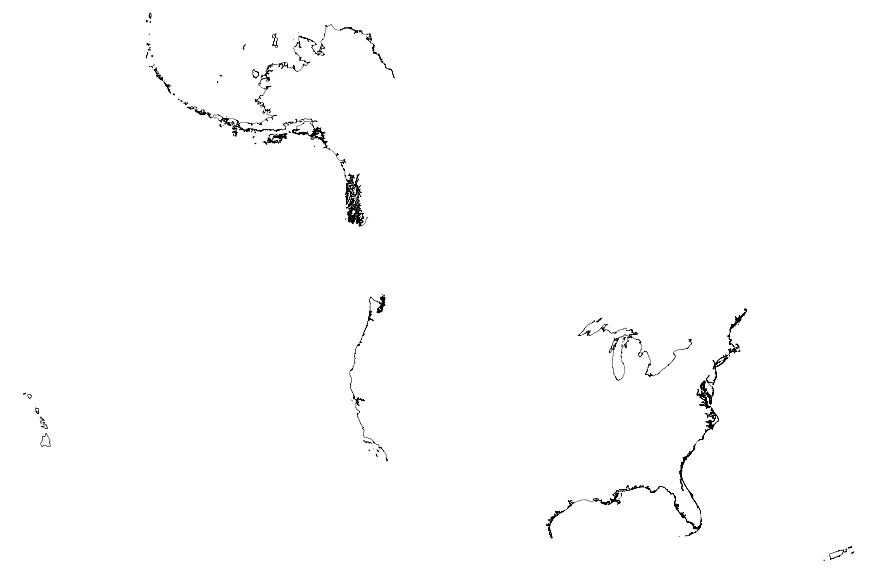
This map layer portrays the coastline of the United States, Puerto Rico, and the U.S. Virgin Islands. The United States shoreline of the Great Lakes is also included. This is a revised version of the July 2012 map layer.
This map layer shows elevation contour lines for Hawaii. The map layer was derived from the 100-meter resolution elevation data set which is published by the National Atlas of the United States, and is in the same Albers Equal-area Conic projection as that source data set. Contour intervals match the steps used in the National Atlas Color-Sliced Elevation data sets. Contours were adjusted so that they are in the proper relationship to National Atlas 1:1,000,000-scale lakes, reservoirs, and wide (double-line) streams.
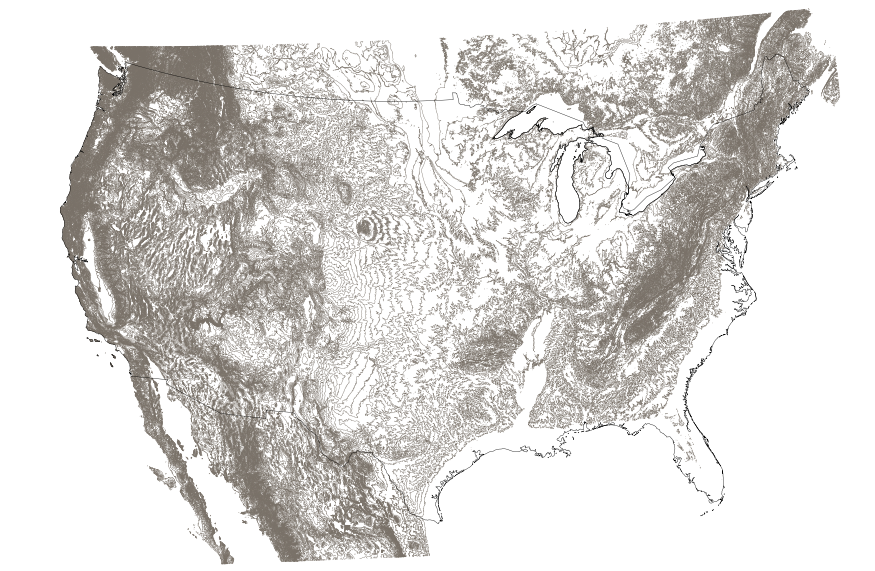
This map layer shows elevation contour lines for the conterminous United States. The map layer was derived from the 100-meter resolution elevation data set which is published by the National Atlas of the United States, and is in the same Albers Equal-area Conic projection as that source data set. Contour intervals match the steps used in the National Atlas Color-Sliced Elevation data sets. Contours were adjusted so that they are in the proper relationship to National Atlas 1:1,000,000-scale lakes, reservoirs, and wide (double-line) streams.

This map layer portrays the State boundaries of the United States, Puerto Rico, and the U.S. Virgin Islands. The map layer was created by extracting county polygon features from the CENSUS 2006 TIGER/Line files produced by the U.S. Census Bureau. These files were then merged into a single file and county boundaries within States were removed. This is a revised version of the July 2012 map layer.
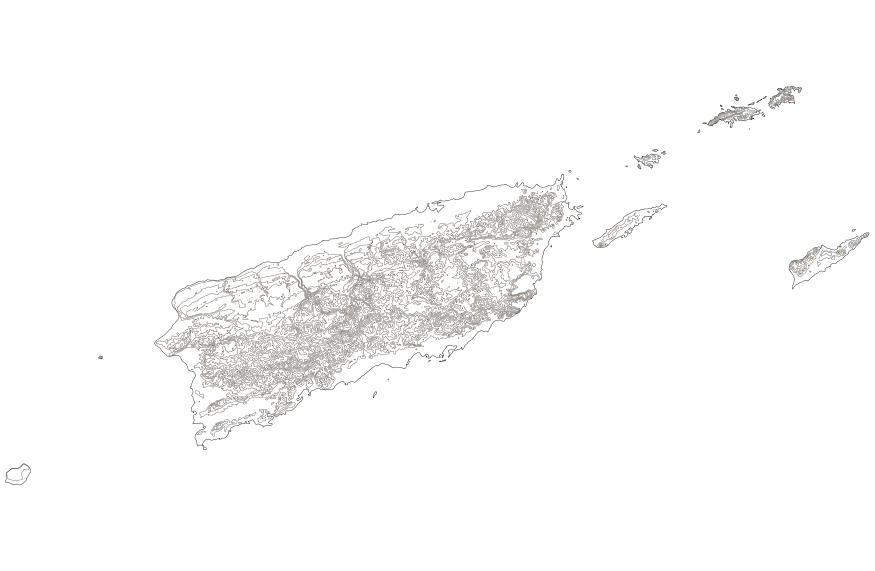
This map layer shows elevation contour lines for Puerto Rico and the U.S. Virgin Islands. The map layer was derived from the 100-meter resolution elevation data set which is published by the National Atlas of the United States, and is in the same Albers Equal-area Conic projection as that source data set. Contour intervals match the steps used in the National Atlas Color-Sliced Elevation data sets. Contours were adjusted so that they are in the proper relationship to National Atlas 1:1,000,000-scale lakes, reservoirs, and wide (double-line) streams.
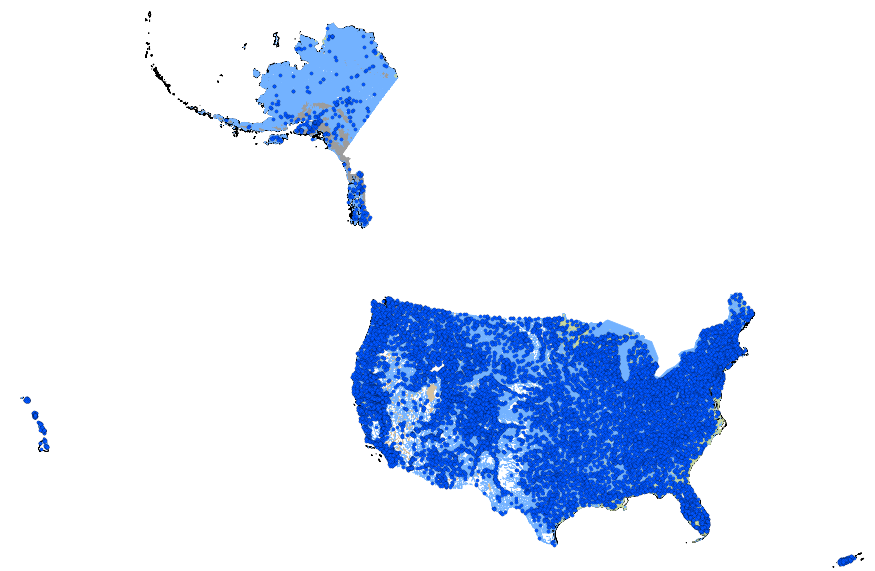
This geodatabase contains streams, waterbodies and wetlands, streamflow gaging stations, and coastlines for the United States, Puerto Rico, and the U.S. Virgin Islands. The streams are incorporated into a geometric network. All feature classes are vertically integrated with each other and with 1:1,000,000-scale transportation and boundary data sets.
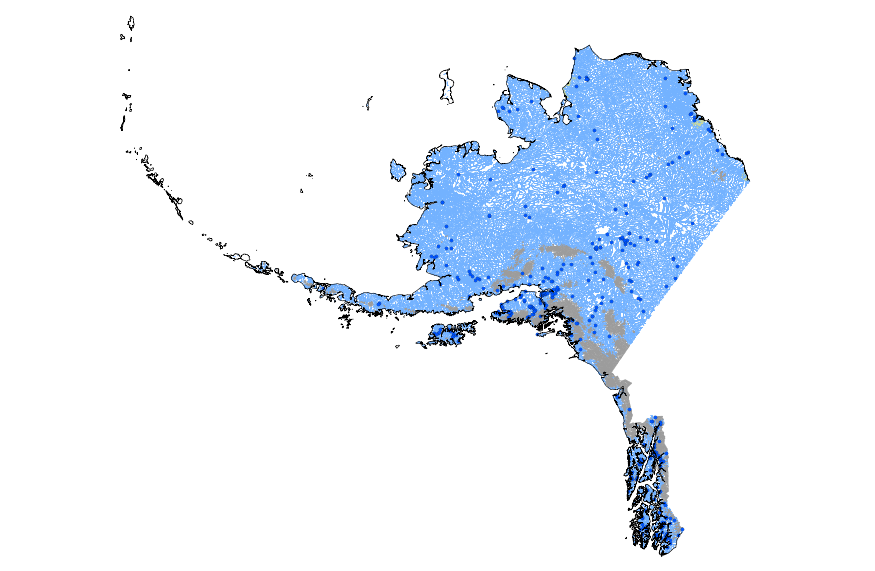
This geodatabase contains streams, waterbodies and wetlands, streamflow gaging stations, and coastlines for Alaska. The streams are incorporated into a geometric network. All feature classes are vertically integrated with each other and with 1:1,000,000-scale transportation and boundary data sets.
This map layer includes railroads in the conterminous United States and Alaska. This is a revised version of the July 2012 map layer.
This geodatabase contains streams, waterbodies and wetlands, streamflow gaging stations, and coastlines for Hawaii. The streams are incorporated into a geometric network. All feature classes are vertically integrated with each other and with 1:1,000,000-scale transportation and boundary data sets.

This map layer includes railroads in the conterminous United States and Alaska. This is a revised version of the July 2012 map layer.
USGS Small-scale Dataset - 1:1,000,000-Scale County Boundaries of the United States 201403 Shapefile
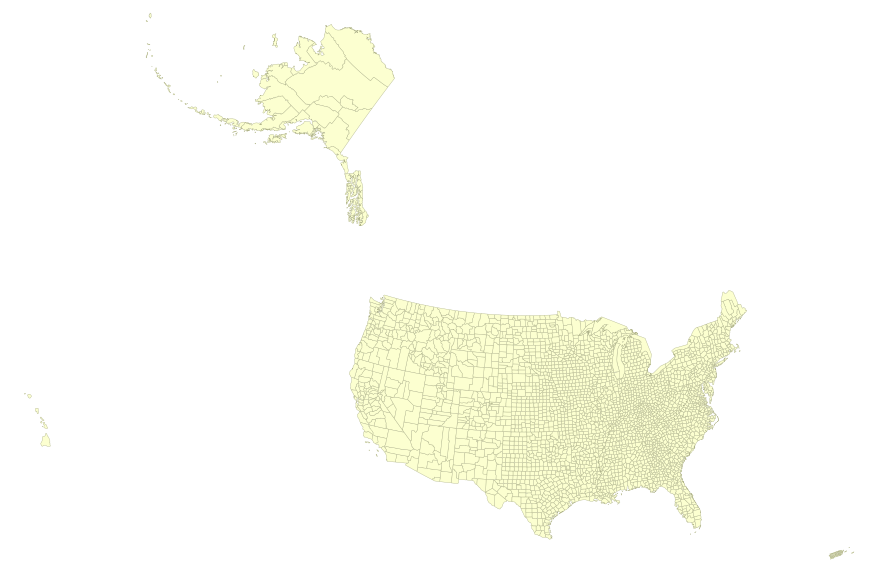
This map layer portrays the county boundaries of the United States, Puerto Rico, and the U.S. Virgin Islands, by showing the counties as areas. The map layer was created by extracting county polygon features from the CENSUS 2006 TIGER/Line files produced by the U.S. Census Bureau. These files were then merged into a single file. This is a revised version of the July 2012 map layer.

This map layer portrays the county boundaries of the United States, Puerto Rico, and the U.S. Virgin Islands, by showing the counties as areas. The map layer was created by extracting county polygon features from the CENSUS 2006 TIGER/Line files produced by the U.S. Census Bureau. These files were then merged into a single file. This is a revised version of the July 2012 map layer.
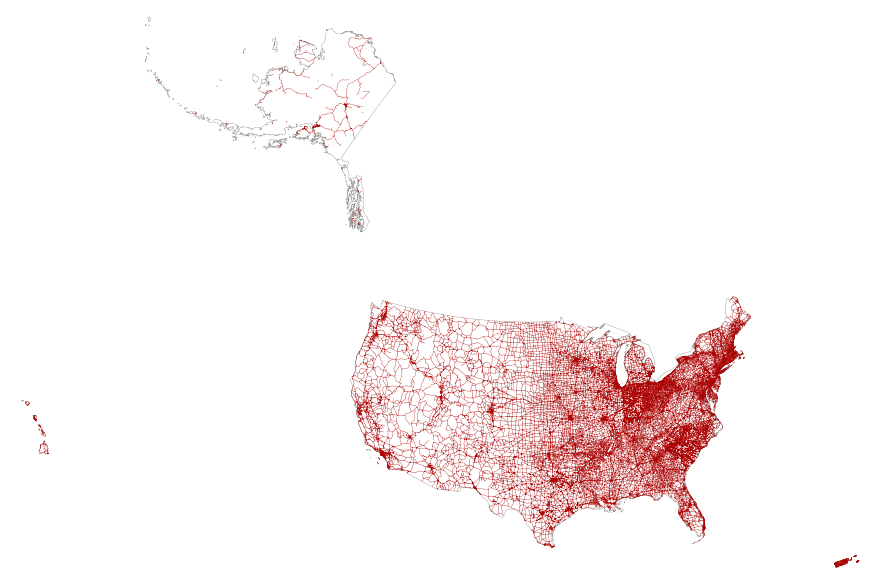
This map layer portrays the major roads in the United States, Puerto Rico, and the U.S. Virgin Islands. The file was produced by joining the individual State roads layers from the National Highway Planning Network (NHPN), Geographic Data Technology (GDT) Dynamap, and TIGER/Line files. This is a revised version of the July 2012 map layer.
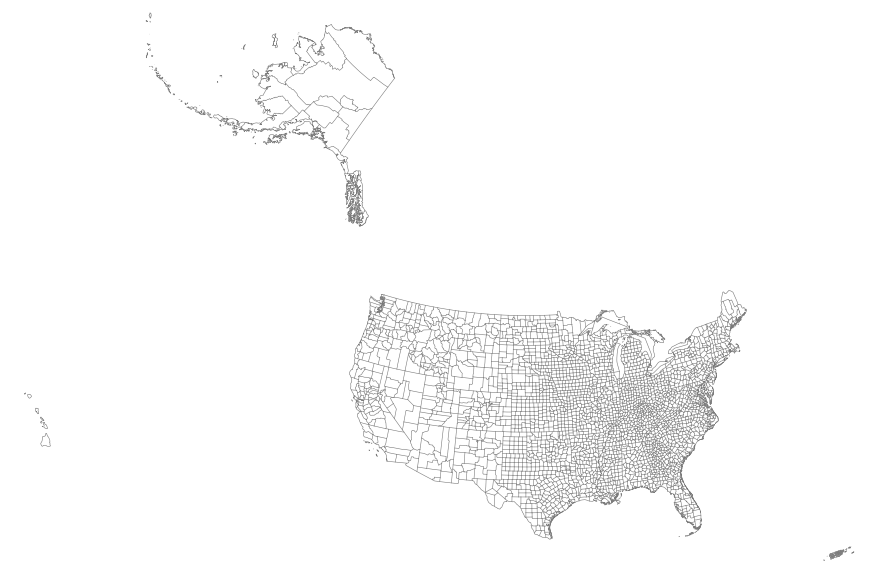
This map layer portrays the county boundaries of the United States, Puerto Rico, and the U.S. Virgin Islands as linework. The map layer was derived from the 1:1,000,000-Scale County Boundaries of the United States polygon data set by applying the Arc/Info Clean function. The Clean function eliminates the duplicate arcs present in polygon shapefiles, leaving one copy of each line.
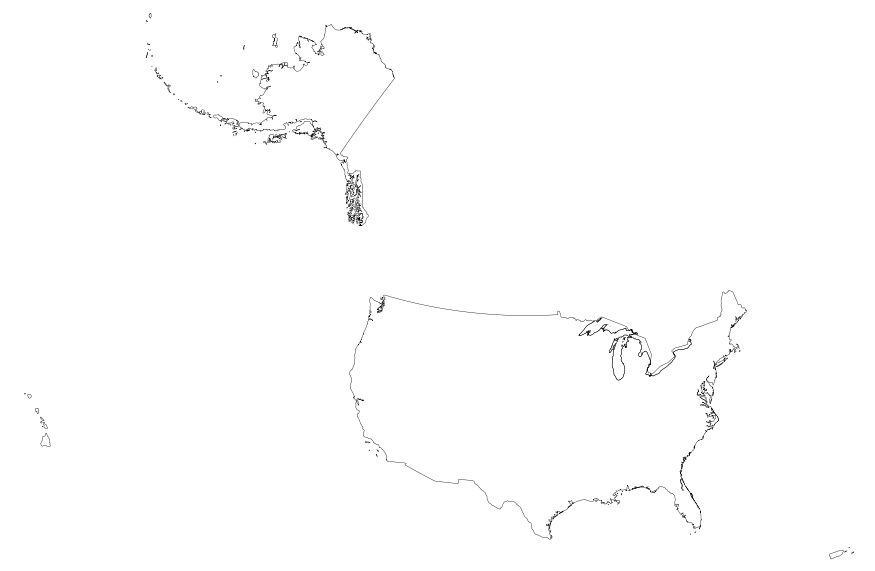
This map layer portrays the boundaries of the United States, Puerto Rico, and the U.S. Virgin Islands. The map layer was created by extracting county polygon features from the 2006 Census TIGER/Line files produced by the U.S. Census Bureau. These files were then merged into a single file and the county and State boundaries were dissolved, leaving the national boundary. This is a revised version of the July 2012 map layer.
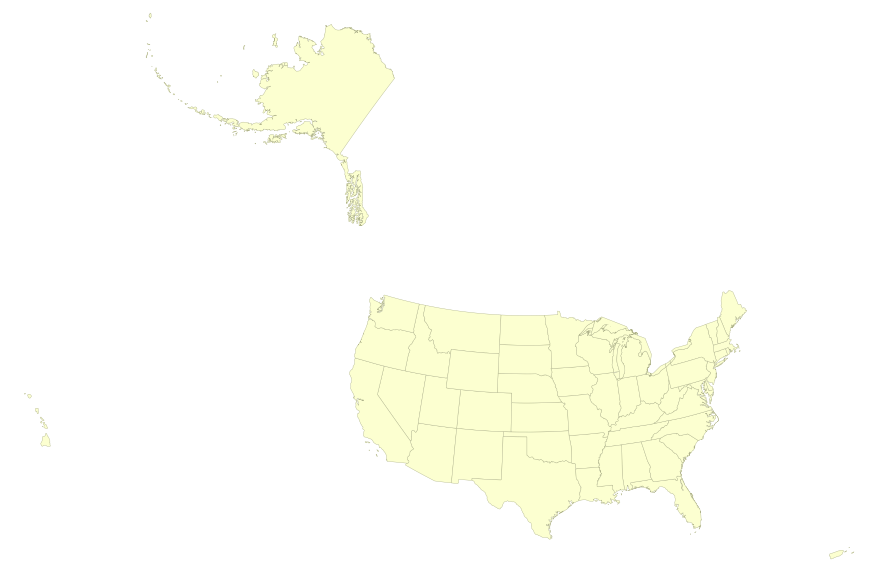
This map layer portrays the State boundaries of the United States, Puerto Rico, and the U.S. Virgin Islands. The map layer was created by extracting county polygon features from the CENSUS 2006 TIGER/Line files produced by the U.S. Census Bureau. These files were then merged into a single file and county boundaries within States were removed. This is a revised version of the July 2012 map layer.
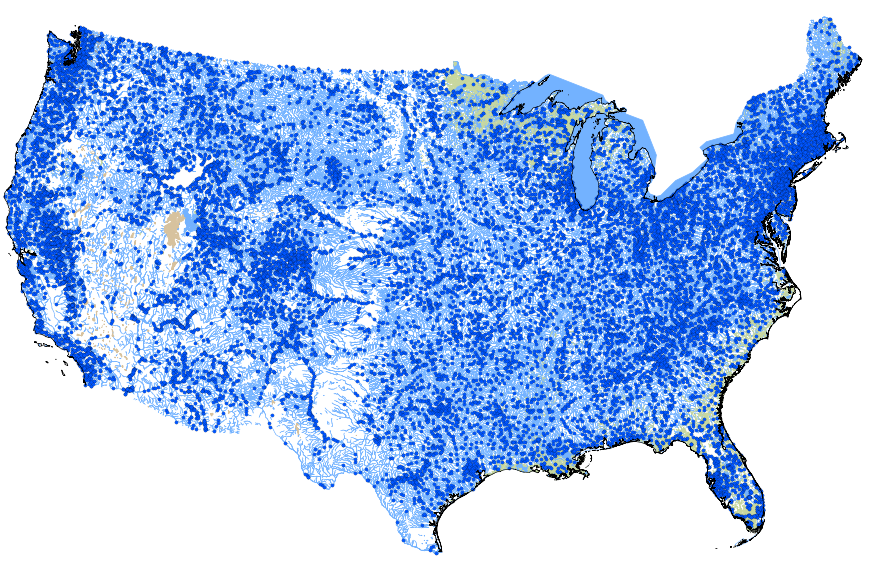
This geodatabase contains streams, waterbodies and wetlands, streamflow gaging stations, and coastlines for the conterminous United States. The streams are incorporated into a geometric network. All feature classes are vertically integrated with each other and with 1:1,000,000-scale transportation and boundary data sets.
|

|
